
Chapter 6: Structural Identification of Organic Compounds: IR and NMR Spectroscopy
6.7 ¹H NMR Spectra and Interpretation (Part II)
6.7.1 Integration of Signal Areas
The computer in the NMR instrument can be instructed to mathematically integrate the area under a signal or group of signals. The signal integration process is very useful in the 1H NMR spectrum because the area under a signal is proportional to the number of protons to which the signal corresponds.
Fig. 6.7a shows the 1H NMR spectrum of 1,4-dimethylbenzene with an integration line (blue lines). The integration line generated by the computer is always in a curved shape that resembles steps. The integration numbers are also generated by the computer together with the curve, which shows the relative area of each signal (the integration numbers in the actual spectra are usually with decimals, but whole numbers are shown here for simplicity).
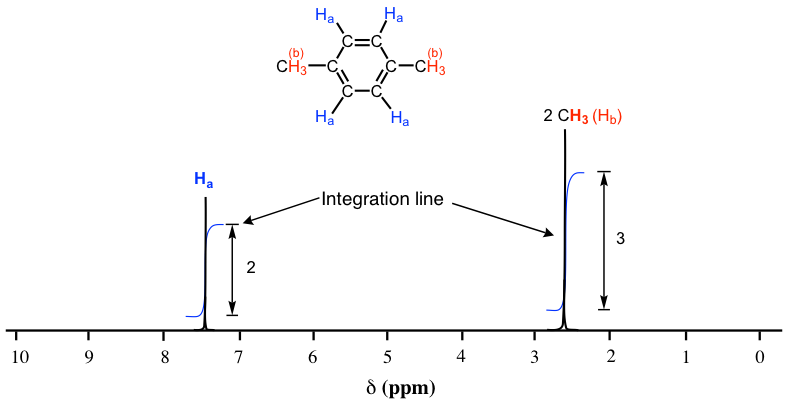
As we discussed earlier, the molecule of 1,4-dimethylbenzene has two sets of equivalent protons: the four aromatic (Ha) protons and the six methyl (Hb) protons. The integration of the area under the peak at 2.6 ppm is 1.5 times greater than the area under the peak at 7.4 ppm. Please note that the integration number shows the relative ratio of the number of protons, not the actual number. The ratio of 3 to 2 here matches the ratio of the actual number 6 to 4. This integration information, along with the chemical shift knowledge we have learned before allows us to assign the peaks: the peak at 7.4 ppm corresponds to protons (Ha) on the benzene ring, and the peak at 2.6 ppm corresponds to two methyl groups (Hb).
6.7.2 Signal Splitting (Coupling)
In the 1H NMR spectra we have seen so far, each set of protons generates a single NMR signal. This is not that common for 1HNMR. In fact, the 1H NMR spectra of most organic molecules contain signals that are ‘split’ into two or more peaks, which is called splitting (or coupling). The spectra with peak splitting may look more complicated, but this splitting behavior provides very useful information about the structure of a compound.
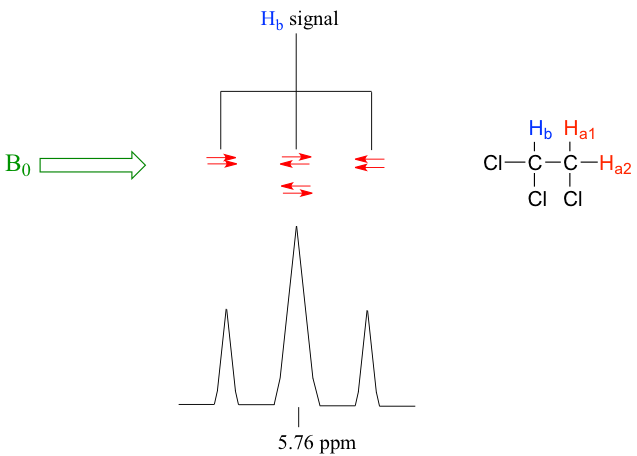
Let’s consider the spectrum for 1,1,2-trichloroethane (Fig. 6.7b). In this and in other spectra to follow, the expansions of individual signals are shown so that the splitting patterns are recognizable.
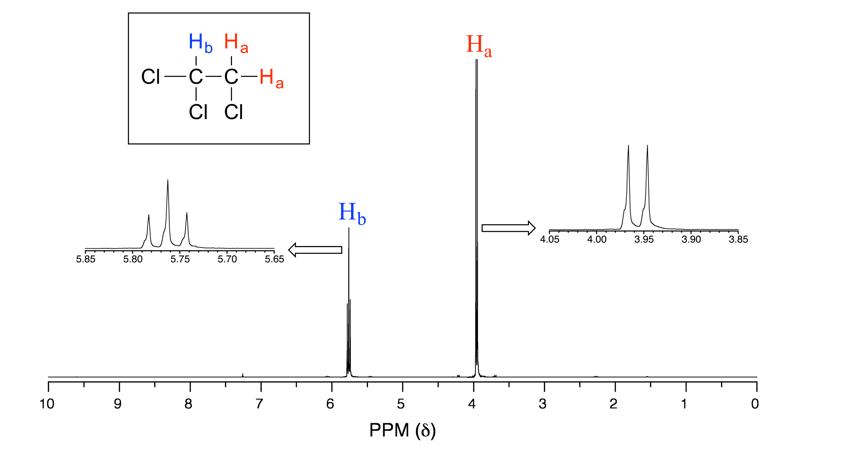
The signal at 3.96 ppm, corresponding to the two Ha protons, is split into two peaks of equal height (and area) – this is referred to as a doublet. The Hb signal at 5.76 ppm, on the other hand, is split into three peaks, with the middle peak higher than the two outside peaks, and the integration ratio between the three peaks is 1:2:1. Such a splitting signal is called a triplet.
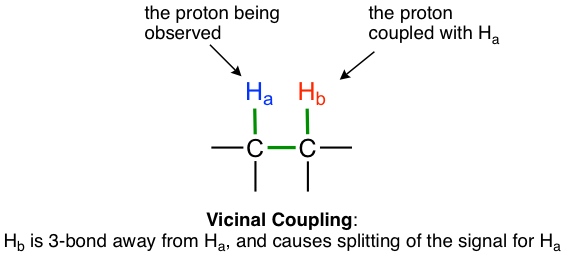
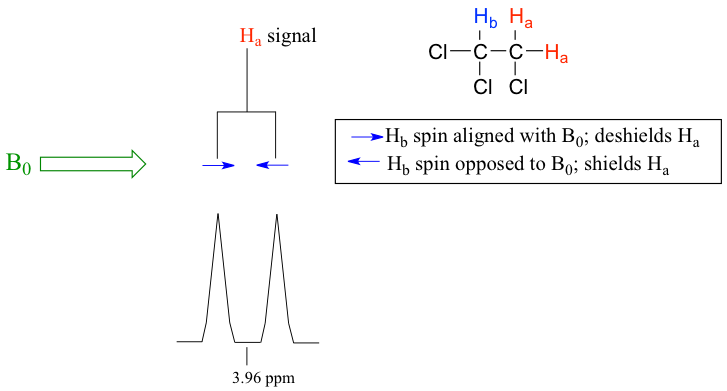
Signal splitting is caused by spin-spin coupling, a term that describes the magnetic interactions between non-equivalent hydrogen atoms that are separated by 2 or 3 σ bonds. The nearby protons have a magnetic moment that can be either against or with the external magnetic field; therefore, the energy levels of the protons whose signal is being observed are split, and this results in the splitting of the signal into multiple peaks (the terms ‘splitting’ and ‘coupling’ are often used interchangeably when discussing NMR).
The most typical coupling we observed in this course is from non-equivalent vicinal hydrogens that are 3 bonds away, that is the hydrogens on adjacent carbons. This is also called vicinal coupling or three-bond coupling.
A simple rule that applies for predicting the number of peaks (or splitting pattern) expected from coupling and the rule in 1H NMRis:
number of peaks = n + 1
(n is the number of vicinal non-equivalent hydrogens)
We will examine the splitting pattern with a different number of n:
- When n=0, the signal is a singlet, or has only one peak, such as the signals observed in Fig. 6.6d and Fig. 6.7a.
- When n=1, the signal is a doublet with two peaks. The area ratio of the two peaks for a doublet is 1:1. The space between the two peaks is called the coupling constant, Jab, which is measured in Hz.
For the example of compound 1,1,2-trichloromethane, the signal of Ha protons fits into this situation. With only one vicinal proton, Hb, on the adjacent carbon, the signal of Ha shows as a doublet.
- When n=2, the signal is a triplet with three peaks. The three peaks of the triplet have a ratio of the area of 1:2:1.
In the same compound 1,1,2-trichloromethane, the signal of the Hb proton fits into this situation. With two vicinal protons, 2Ha, on the adjacent carbon, the signal of Hb shows as a triplet.
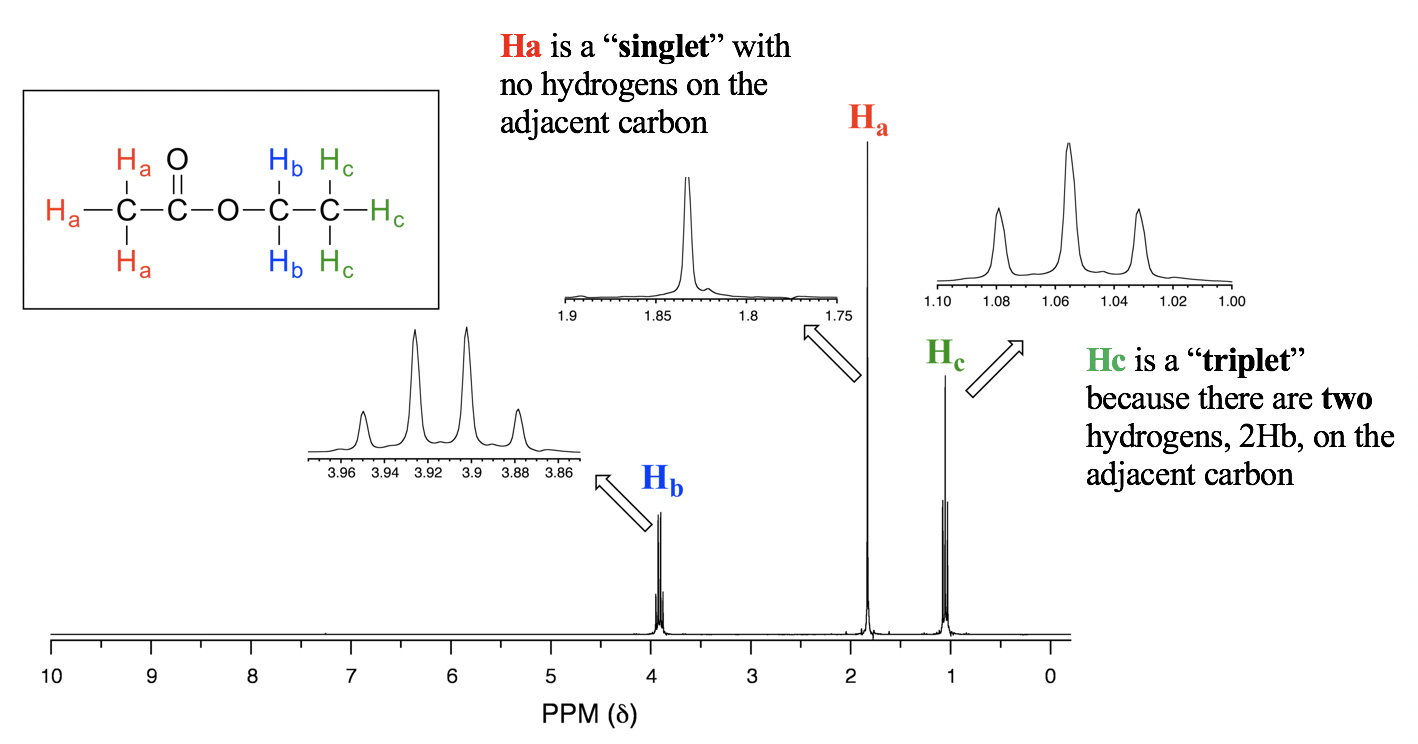
- When n=3, the signal is a quartet, which means it has four peaks. The four peaks of the quartet have an area ratio of 1:3:3:1.For the spectrum of ethyl acetate (Fig. 6.7e), the signal of Hb is a quartet because there are three vicinal protons 3Hc on the adjacent carbon. Please note that the carbon with Hb is connected with oxygen on the other side, and there are no hydrogen atoms on that oxygen atom, so only the coupling with three vicinal protons applies.
- When n≥4, the signal can be called a multiplet. Theoretically, with n increase the signal splits into more peaks and the total number of peaks is “n+1”. However, the small peaks on the sides may or may not be able to be observed since they might be merged into noise. The signals with more than four peaks are generally called multiplets, and it is not that critical to tell exactly how many peaks are involved in a multiplet.
Extra notes about signal splitting:
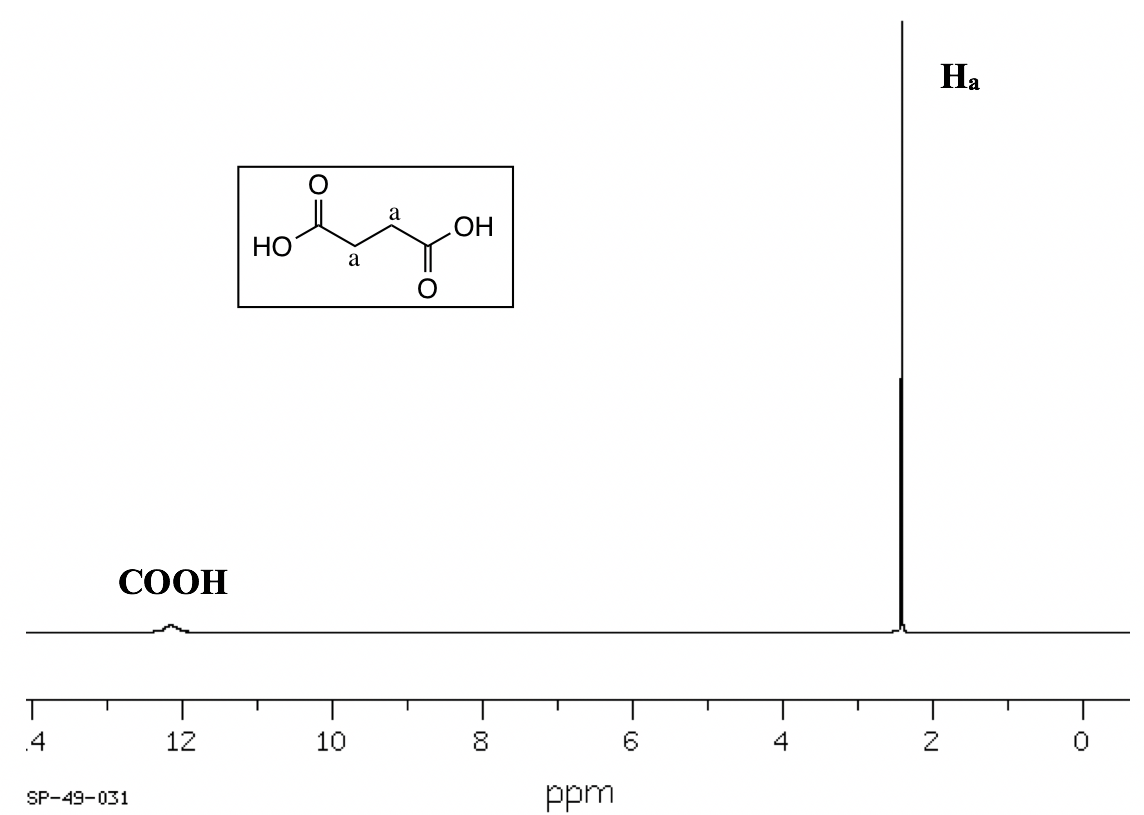
- Splitting (coupling) only occurs between nonequivalent protons. For equivalent protons, there is no coupling. In the spectrum of succinic acid (Fig. 6.7f), for example, the protons on the two middle carbons are equivalent (Ha), so there is no coupling between them and they show a singlet.
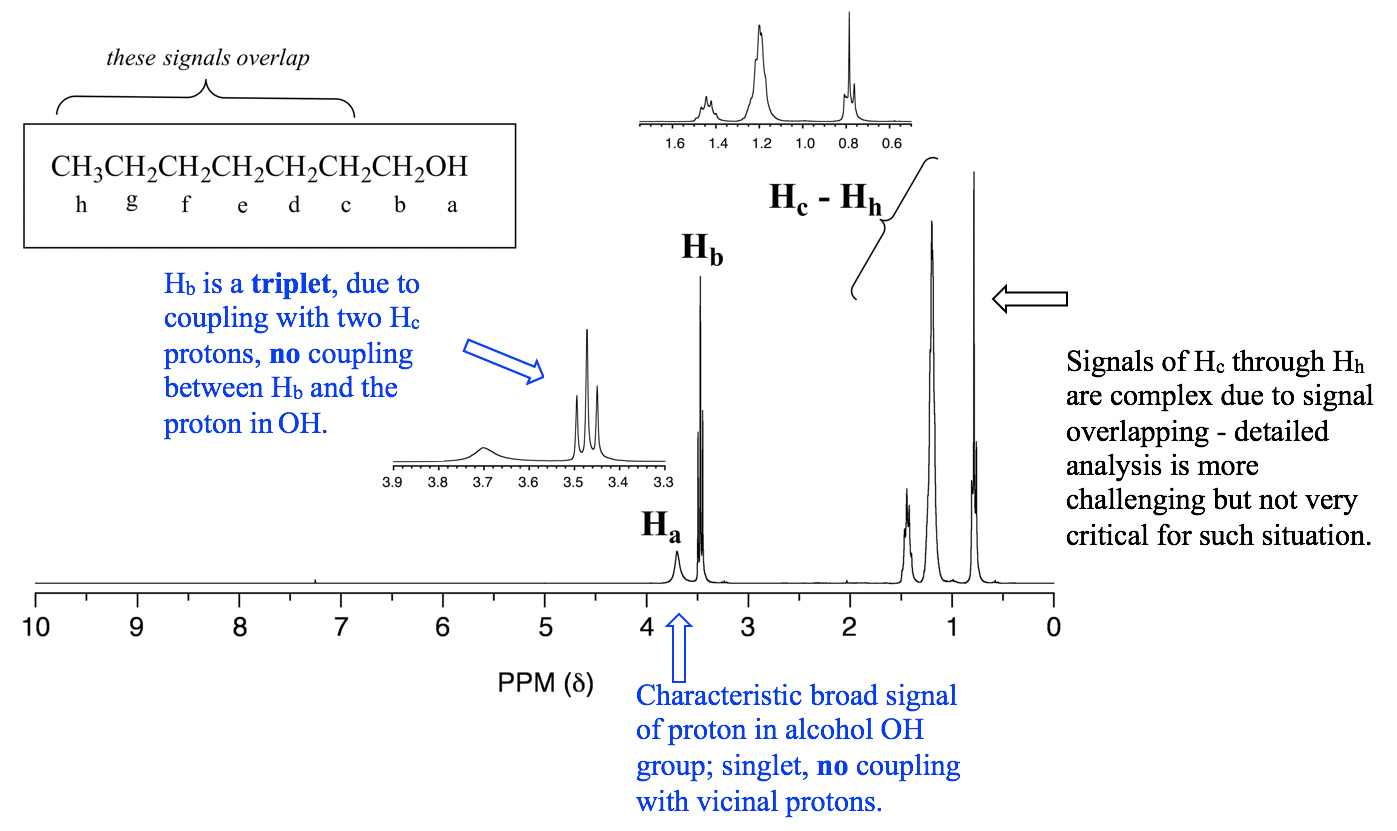
2. Protons in OH or NH generally do not couple with vicinal hydrogens. OH and NH protons are acidic enough to rapidly exchange between different molecules, so the neighboring protons never actually ‘feel’ their influence. See the specific example of the 1-heptanol spectrum in Fig. 6.7g.
6.7.3 1H NMR Practice
Signal assignment based on the given structure
With the structure of a compound given, we can apply all the knowledge about 1H NMR to assign the signals in the spectrum to identify which signals come from which hydrogen(s).
Examples
Match the 1H NMR spectrum below to its corresponding compound, and assign all of the signals.

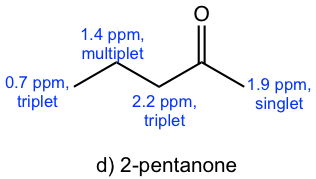
a) cyclopentanone b) 3-pentanone c) butanal d) 2-pentanone
e) 4-heptanone f) 1-butene
Approach: It is a good idea to draw the structure of each compound and try to see which matches the spectrum.

The spectrum has four signals: triplet (~0.7 ppm), multiplet (~1.4 ppm), singlet ( ~1.9 ppm) and triplet (~2.2 ppm). Based on the structure of each compound, compound c), d) and f) should have four signals in the 1H NMR spectrum.
- There is no signals at about 9 ppm for the aldehyde hydrogens in the spectra, so the spectrum is not for compound c) , butaldehyde.
- There is no signals at about 4~5 ppm for the alkene hydrogens in the spectra, so the spectrum is not for compound f) , 1-butene.
- The signals in the spectrum match with what are expected for compound d), 2-pentanone.
Solution: The spectrum is for 2-pentanone.
Structure Determination based on 1H NMR spectrum
For an advanced level of practice, we are supposed to be able to determine the exact structure of a compound with the 1H NMR spectrum given (and other necessary information). As we have learned, much valuable information about the structure of a compound can be obtained from a 1H NMR spectrum. In summary, analyzing the four features of the spectrum is critical to elucidate the structure of a compound:
- The number of signals indicates how many different sets of protons there are in the molecule.
- The chemical shift of the signal tells us about the electronic environment of each set of protons.
- The integration under each signal provides information about how many protons there are in the set being measured (keep in mind that the integration values are for the ratio, not the actual number of protons).
- The splitting pattern of each signal indicates the number of protons on atoms adjacent to the one whose signal is being measured.
We will see examples of structure determination in section 6.9.
