
Chapter 6: Structural Identification of Organic Compounds: IR and NMR Spectroscopy
6.2 Infrared (IR) Spectroscopy Theory
In IR spectroscopy, how the vibration mode of covalent bonds is affected by absorbing IR electromagnetic radiation is studied. Covalent bonds in organic molecules are not like rigid sticks; instead, they behave as if they were vibrating springs. At room temperature, organic molecules are always in motion, which involves several vibration modes, such as stretching, bending, and twisting as illustrated in Fig. 6.2a.
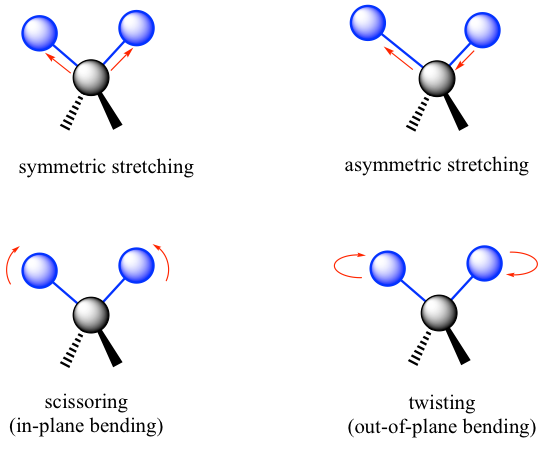
Stretching is the vibration occurring along the line of the bond that changes the bond length. Bending is the vibration that, like a swing, does not occur along the line, but changes the bond angles. The specific bending mode is often referred to by descriptive terms like scissoring, twisting, etc.
One covalent bond may vibrate in different vibrational modes; for example, the C-H bond can be in a stretching and bending mode. Each vibrational mode for a given bond occurs with a characteristic ground state frequency that corresponds to the frequency of the IR region (1013 to 1014Hz, or 2.5 to 17 μm in wavelength) of the electromagnetic spectrum. If a molecule is exposed to IR radiation, it will absorb the radiation that matches the frequency of the vibration of one of its bonds. The IR radiation absorbed allows the bond to vibrate a bit more, that is, increases the amplitude of vibration, but the vibrational frequency will remain the same.
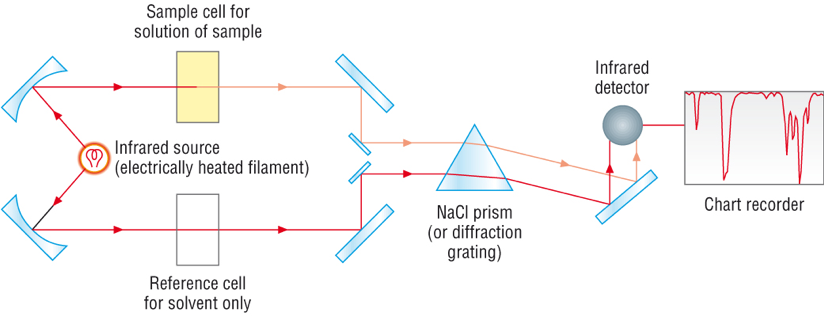
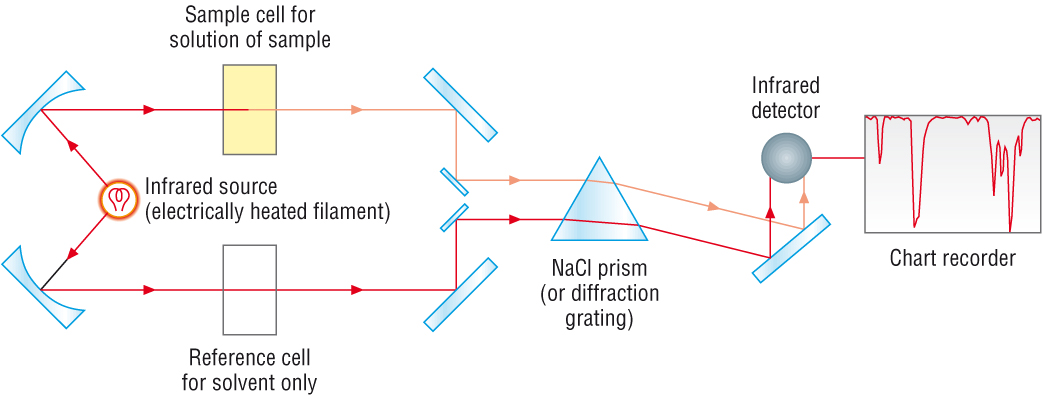
In an infrared spectrophotometer (Fig. 6.2b), a beam of IR radiation passes through the sample, and some radiation is absorbed by the sample, while the remaining radiation goes through it. Another beam of IR radiation passes through the cell with a blank (no sample, no absorption) and all the light goes through it. The detector in the instrument records and compares the radiation transmitted through the sample with that transmitted in the absence of the sample. Any frequencies absorbed by the sample will be apparent by the difference. The computer plots the result as a graph showing transmittance vs frequency (in the format of wavenumber, which will be explained next).
