Chapter 6: Structural Identification of Organic Compounds: IR and NMR Spectroscopy
6.6 ¹H NMR Spectra and Interpretation (Part I)
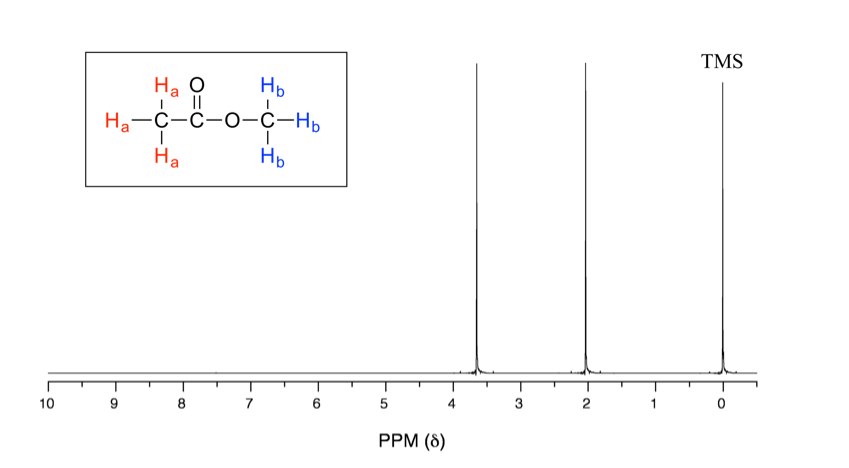
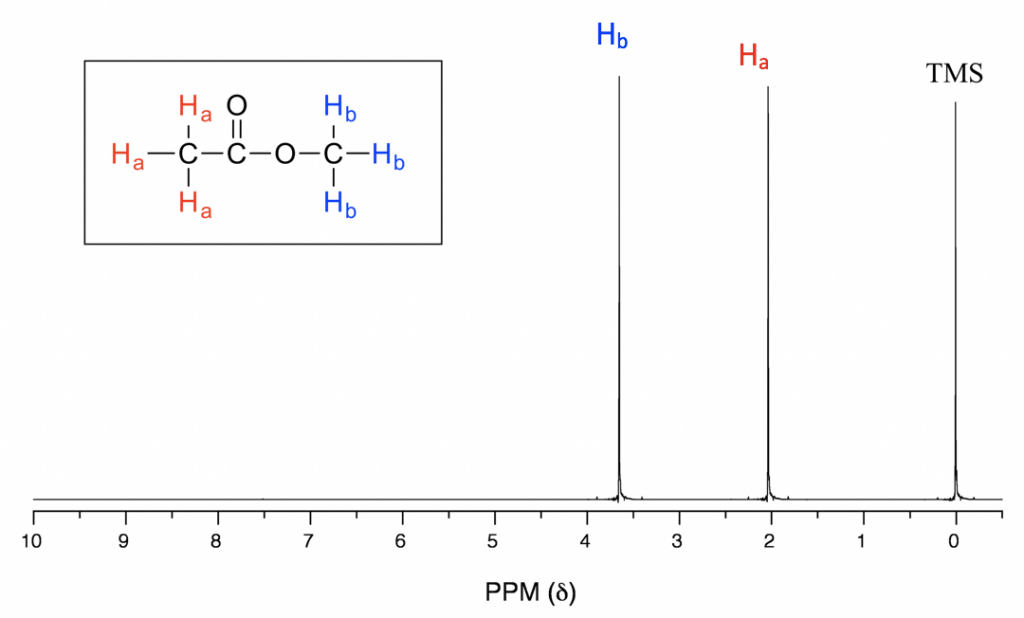
Understanding the basics of NMR theory gets us ready to move on to the most important and practical part of this section, which is how to understand the 1H NMR spectrum and elucidate the structure of a compound from 1H NMR spectrum information. Let’s first take a look at an actual 1H NMR spectrum, the spectrum of methyl acetate in Fig. 6.6a.
Generally, information about the structure of a molecule can be obtained from four aspects of a typical 1H NMR spectrum:
- Chemical equivalent and non-equivalent protons (total number of signals)
- Chemical shift
- Integration
- Signal splitting
6.6.1 Chemical Equivalent and Non-Equivalent Protons
In the above 1H NMR spectrum of methyl acetate (Fig. 6.6a), we can see that there are three signals. The peak at the far right is for the standard reference compound tetramethylsilane (TMS, which is further discussed in the chemical shift section 6.6.2), not for the compound. So, the compound methyl acetate shows two signals in the 1H NMR spectrum. Why are there only two signals for a compound containing a total of six hydrogens?
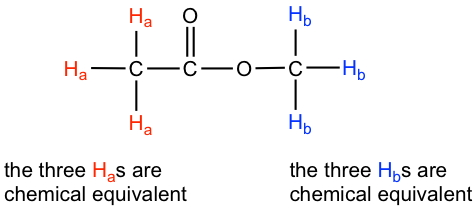
This is because of chemical equivalence. The six hydrogens can be divided into two groups, the three Ha protons in the methyl group that bonded with C=O are all in the same chemical environment, so they are chemical equivalent. All chemical equivalent hydrogens have the same resonance frequency when applied to an external magnetic field, so they show only one signal in the 1H NMR spectrum. The three Hb protons in the methyl group bonded with the O atom are chemical equivalent as well and show the other signal. That is why there are two signals for the compound methyl acetate.
The ability to recognize chemical equivalent and non-equivalent protons in a molecule is very important to understanding the NMR spectrum. For the compound with the structure given, we should be able to predict how many signals there are in the 1H NMR spectrum. On the other hand, if the 1H NMR spectrum is available for an unknown compound, counting the number of signals in the spectrum tells us the number of different sets of protons in the molecule, and that is very important information for determining the structure of the compound.
Here, we will go through several examples for the first situation, which is to predict the number of signals in the 1H NMR spectrum with the structure of a compound given. To do that, we need to count how many distinct proton sets are included in the molecule.
For each of the following molecules, the chemically equivalent protons are labeled in the same color to facilitate understanding.
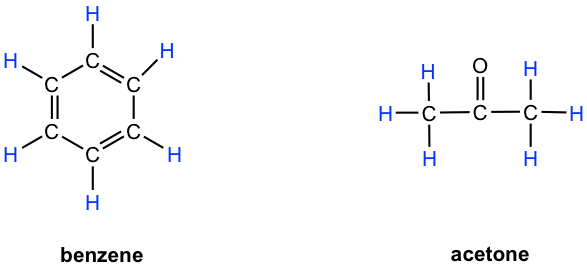
- Benzene: all six protons are chemical equivalent (have the same bonding and are in the same chemical environment) to each other and have the same resonance frequency in a 1H NMR experiment; therefore, they show only one signal.
- Acetone: both methyl groups (two CH3) bonded with a C=O bond, so they are in the same chemical environment, and as a result, all six protons are chemical equivalent and show only one signal.
Notes: As you have probably already realized, chemical equivalence or non-equivalence in NMR is closely related to symmetry. Protons that are symmetric to each other by a certain plane of symmetry are chemical equivalent.
The molecules in the next figure contain more sets of chemically equivalent protons.
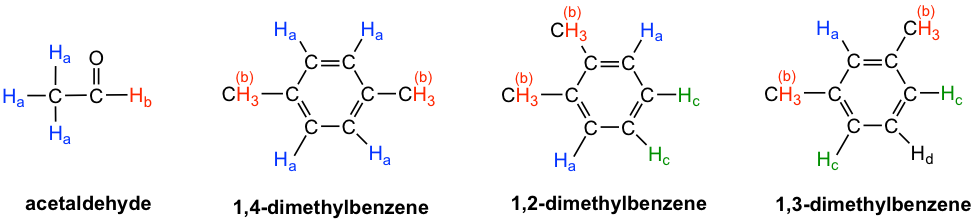
- Acetaldehyde: The three Ha protons in the methyl group are chemical equivalent, and they all bonded to an sp3-hybridized carbon; but they are different from the Hb proton that is bonded to an sp2–hybridized carbonyl carbon. There are two total signals in the 1H NMR spectrum.
- 1,4-dimethylbenzene: all four aromatic protons are chemically equivalent because of the symmetry. The two methyl groups are equivalent to each other as well. There are two signals in total in the 1H NMR spectrum.
- 1,2-dimethylbenzene: both Ha protons are adjacent to a methyl substituent, while both Hc protons are two carbons away. So, the four aromatic protons are divided into two sets. Both methyl groups are in the same bonding and are symmetric to each other; they are equivalent. There are three signals in total in the 1H NMR spectrum.
- 1,3-dimethylbenzene: Hb is situated between two methyl groups, the two Hc protons are one carbon away from a methyl group, and Hd is two carbons away from a methyl group. Therefore, the four aromatic protons can be divided into three sets. The two methyl groups are equivalent. There are four signals in total in the 1H NMR spectrum.
Exercises 6.1
How many 1H NMR signals would you predict for each of the following molecules?

Answers to Chapter 6 Practice Questions
6.6.2 Chemical Shift
As seen in the 1H NMR spectrum of methyl acetate (Fig. 6.6a), the x-axis units of the NMR spectrum are in ppm (not in Hz, as we would expect for frequency), and the two signals stand at different positions along the x-axis. Let’s explain how that works and what information can be obtained.
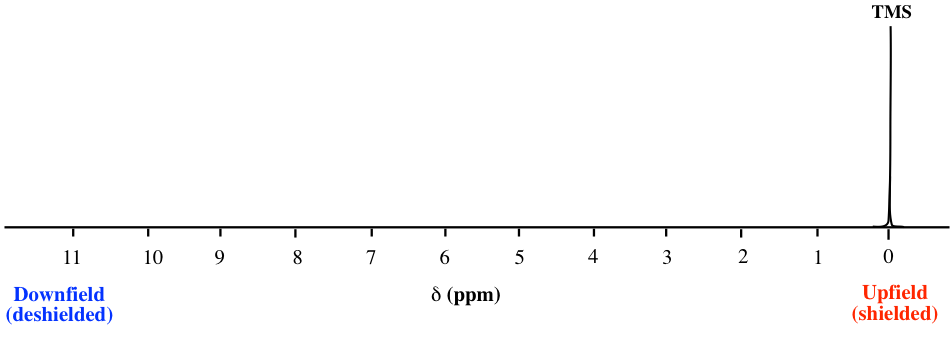
The position of a signal along the x-axis of an NMR spectra is called the chemical shift, or δ, of the signal. Chemical shift is determined by the structural electronic environment of the nuclei producing that signal. Protons in different chemical environments (non-equivalent) show signals at different chemical shifts. The direction of the chemical shift scale in the x-axis is opposite to what we are familiar with; that is, the smaller value is at the right-hand side, and the larger value is at the left-hand side (Fig. 6.6b).
- Smaller chemical shift (δ) values correspond with a lower resonance frequency.
- Larger chemical shift (δ) values correspond with a higher resonance frequency.
By convention, the right-hand side of an NMR spectrum with smaller chemical shift values is called upfield, and the left-hand direction is called downfield (Fig. 6.6b).
For protons that are shielded, because of the Blocal caused by circulating electrons, the magnetic field experienced by the proton, Beff, is smaller than the applied external field, Bo, so the protons have a lower resonance frequency and have smaller chemical shift values.
- Shielded protons have a lower resonance frequency and smaller chemical shift (d) values.
- Deshielded protons have a higher resonance frequency and larger chemical shift (d) values.
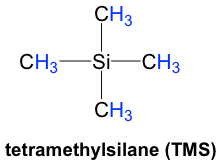
In the 1H NMR spectrum, the absorption of the protons of TMS (tetramethylsilane) is defined as “zero” on the chemical shift (δ) scale, and the absorption of other protons is reported as a relative shift compared with that of TMS.
TMS was chosen as a reference compound and defined as “zero” for several reasons. Since silicon is less electronegative than carbon, the hydrogens of TMS are in a high electron-density environment; therefore, they are highly shielded with a very low resonance frequency and rarely interfere with the signals of other compounds. Also, there are twelve equivalent hydrogens in TMS that show a single signal, so the signal is strong, even with a very small amount of TMS. TMS is also quite inert and easy to be removed with a b.p. of 27ºC. A small amount of TMS was added in the sample as an internal standard for NMR measurement and removed by evaporation afterwards. However, for a contemporary NMR spectrometer (including a benchtop NMR), it is no longer necessary to actually add TMS since the computer can calibrate the chemical shift electronically based on the resonance frequencies of the solvent used.
The unit of chemical shift (δ) is ppm. The ‘ppm’ label stands for ‘parts per million’. The chemical shift relative to TMS in ppm is defined as the formula below.
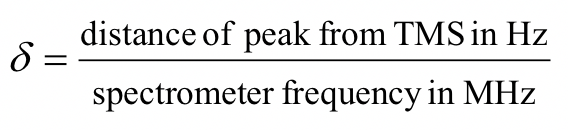
The reason for using a relative value of chemical shift in ppm rather than the actual resonance frequency in Hz is that every NMR instrument will have a different magnetic field strength, so the actual value of resonance frequencies expressed in Hz will be different on different instruments – remember that the ΔE for the magnetic transition of a nucleus depends upon the strength of the externally applied magnetic field Bo. However, the chemical shift expressed in ppm will always be the same whether measured with an instrument operating at 400 MHz or 60 MHz. In the 1H NMR of methyl acetate, the two signals are at 2.0 and 3.6 ppm and represent the two sets of protons in methyl acetate that have resonance frequencies of about 2.0 and 3.6 parts per million higher than the resonance frequencies of the TMS protons. If, for example, the spectrum is measured by the 400-MHz NMR spectrometer, then the chemical shift in Hz will be 800 Hz and 1440 Hz, respectively.
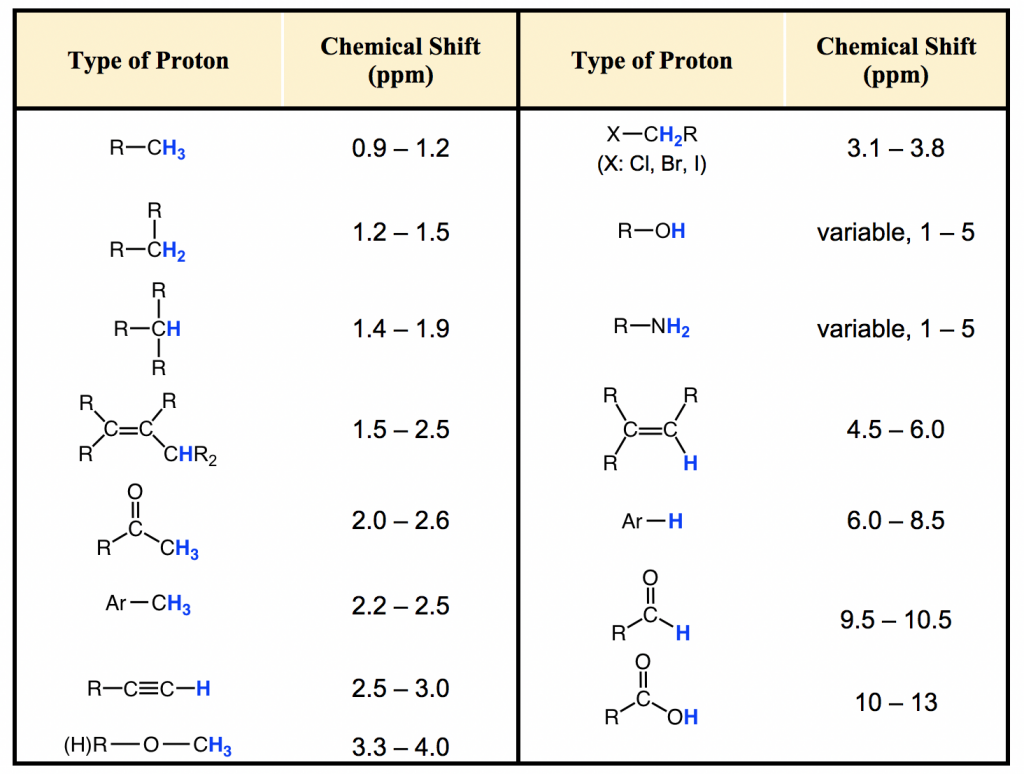
Most protons in organic compounds have chemical shift values between 0 and 12 ppm relative to TMS, though values below 0 ppm and above 12 ppm are occasionally observed. The chemical shift value of hydrogens in a certain structural environment or common organic functional groups is listed in the chart (Fig. 6.6c) and table (Table 6.2) below.
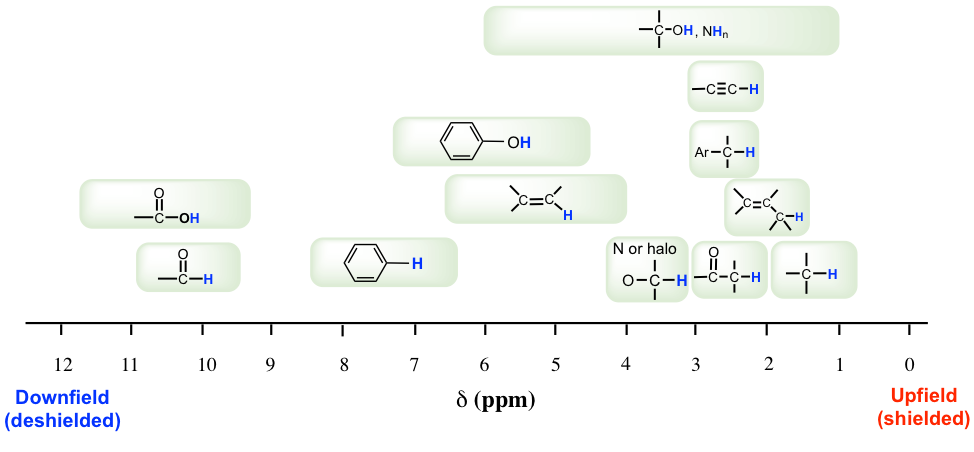
The importance of chemical shift information is that it gives critical clues about molecular structures. Several highlights should be noted:
- Usually, the hydrogens in a C-H bond, without any other functional groups nearby, are in the range of 1–2 ppm;
- for hydrogen in a C-H bond besides a double bond, like a C=C or C=O bond, the signal goes downfield to 2–2.5 ppm;
- with electronegative atoms connected on the carbon, like O-C-H, the hydrogens get deshielded and the chemical shift moves further downfield to 3–4 ppm;
- the hydrogens bonded directly to double bond carbon have a chemical shift at around 4.5–6 pm;
- the aromatic hydrogens (H on the benzene ring) show a chemical shift of around 7 ppm;
- the chemical shift of hydrogens in the OH (alcohol) or NH (amine) group varies in a large range, from 1–5 ppm; and
- the hydrogen in the aldehyde (-CHO) and carboxylic acid (COOH) group has a chemical shift rather downfield at about 9–10 ppm and 10–12 ppm, respectively.
When referring to the chemical shift table (or chart) for a certain compound, it is useful to keep in mind that the exact value may vary to the given range, and sometimes a difference up to 0.5 ppm unit may happen depending on the specific structure and the solvent used.
With chemical shift information available, we can now assign the signals in the 1H NMR spectrum of methyl acetate. According to Fig. 6.6c, the protons in the CH3 group beside the C=O bond are supposed to be in the range of 2–3 ppm, and protons in the CH3 group connected with O directly have δ value of about 3–4 ppm. So, the 2.0-ppm signal is for the Ha group, and the 3.6-ppm signal is for the Hb group.
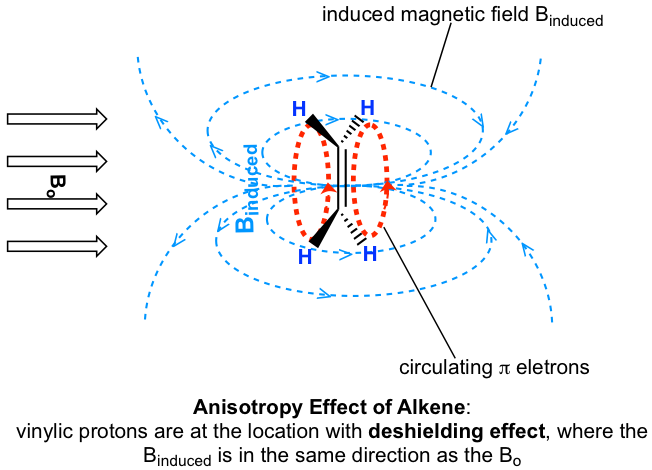
Chemical Shift of Protons Near π Electrons — Anisotropy Effect
The chemical shift values of aromatic protons and vinylic protons (those directly bonded to an alkene carbon) resonate much further downfield (higher frequency, higher chemical shift) than can be accounted for simply by the deshielding effect of nearby electronegative atoms. These chemical shifts result from the anisotropy effect.

Let’s investigate the aromatic protons first. In a benzene ring (and many other aromatic structures), a total of six π electrons form a delocalized big π bond around the ring (further discussion in Organic II). When the molecule is exposed to the external magnetic field Bo, these π electrons begin to circulate in a ring current and generate their own induced magnetic field, Binduced. Whether shielding or deshielding occurs depends on the location of the protons in the induced magnetic field, and this is called an anisotropy (means “non-uniformity”) effect. This can be illustrated specifically in Fig. 6.6e below by comparing between points A and B.
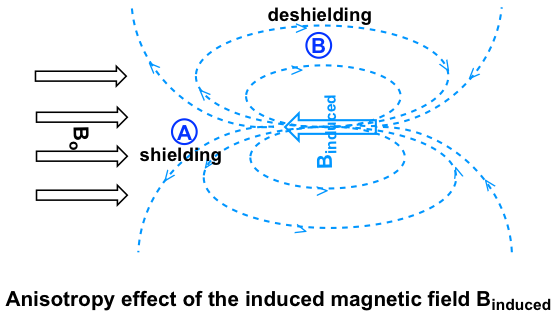
If a proton is at point A, it feels the induced magnetic field pointing to the opposite direction of Bo, so the proton experiences a shielding effect. For the proton at point B, however, it feels the induced magnetic field to the same direction as Bo, so the proton experiences a deshielding effect.
The protons on a benzene ring are at the position equivalent of ‘point B’, which means the induced current in this region of space is oriented in the same direction as B0, so it adds to B0 and results in a deshielding effect and the benzene protons resonate at a higher frequency and has larger chemical shifts.
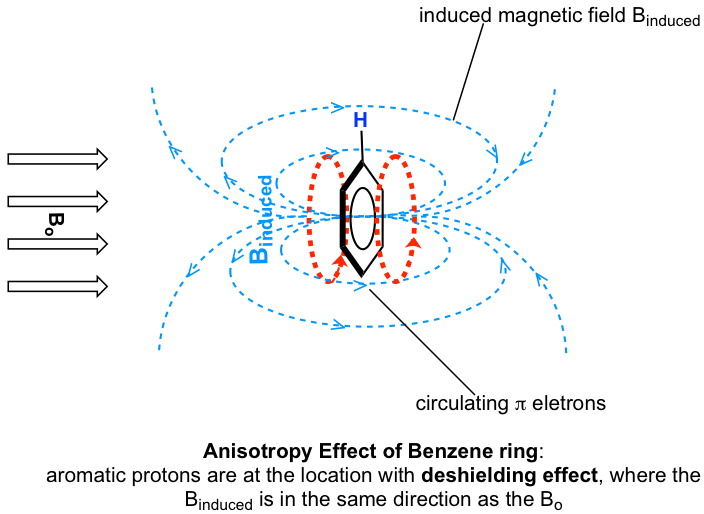
As a result, due to the anisotropy of the induced field generated by the circulating π electrons, the benzene protons are highly deshielded. Their chemical shift is far downfield, in the range of 6.5–8.5 ppm.
Anisotropy is also responsible for the downfield (high frequency) chemical shifts of vinylic protons (4–6.5 ppm) and aldehyde protons (9.5–11 ppm). The π electrons in these groups also circulate in such a way to generate an induced magnetic field that adds to the external field Bo in the spots occupied by the protons. Carboxylic acid protons are even further downfield (9.5–12 ppm) due to the combined influence of the electronegative oxygen atom and the nearby π bond.