Chapter 6: Structural Identification of Organic Compounds: IR and NMR Spectroscopy
6.4 IR Spectrum Interpretation Practice
Now, let’s take a look at the IR spectrum for examples. It is very important to keep in mind that we generally do not try to identify all the absorption bands in an IR spectrum. Instead, we will look at the characteristic absorption band to confirm the presence or absence of a functional group. An IR spectrum usually does not provide enough information for us to determine the complete structure of a molecule, and other instrumental methods have to be applied in conjunction, such as NMR, which is a more powerful analytical method to give more specific information about molecular structures that we will learn about in later sections.

In the IR spectrum of 1-hexanol in Fig. 6.4a, there are sp3 C-H stretching bands of alkane at about 2800–3000 cm-1 as expected. Other than that, there is a very broad peak centered at about 3400 cm-1 which is the characteristic band of the O-H stretching mode of alcohols.

The spectrum for 1-octene (Fig. 6.4b) shows two bands that are characteristic of alkenes: the one at 1642 cm-1 is due to stretching of the carbon-carbon double bond, and the one at 3079 cm-1 is due to stretching of the σ bond between the sp2-hybridized alkene carbons and their attached hydrogens.
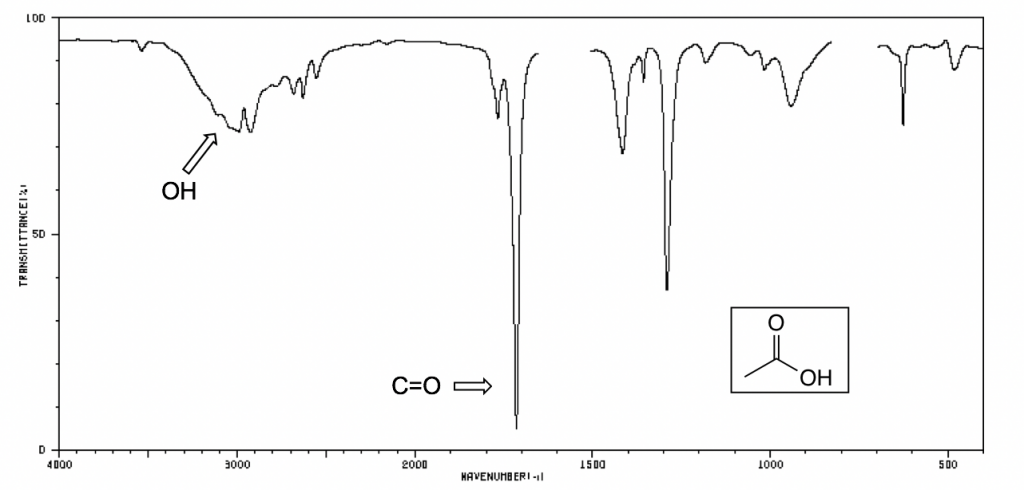
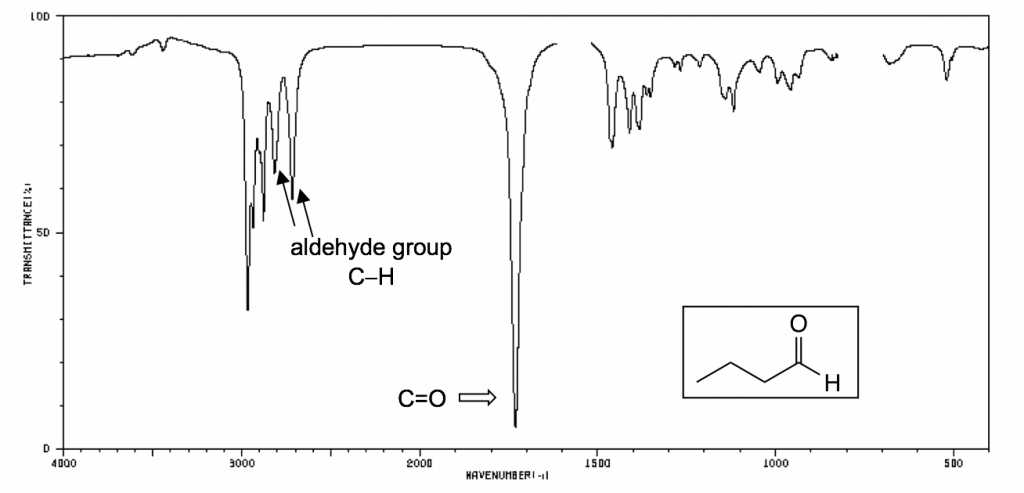
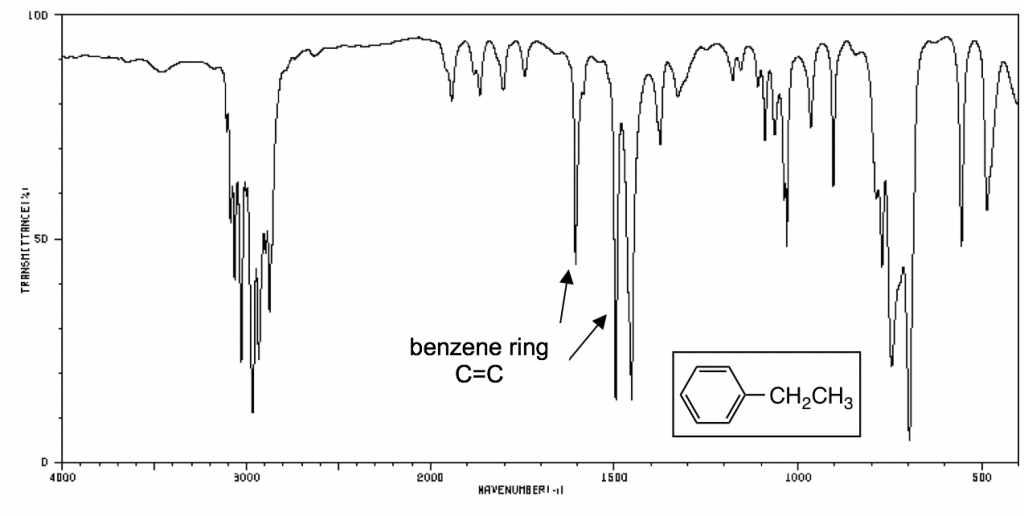
The following IR spectra are taken from Spectral Database for Organic Compounds, a free organic compounds spectral database. The key bands for each compound are labeled on the spectra.