
16. Environmental Criminology
16.5 Geometric Theory
Antonio Robert Verbora
The second theoretical framework associated with environmental criminology is geometric theory (often referred to as geometry of crime). The geometric theory of crime explains patterns of crime based on the geographic dimension of human activity patterns. The focus here is not on the motivation for crime, but rather the perceived opportunities for crime that exist within the urban spatial structure.
In the geometric theory of crime, the environment is conceptualised along the lines of C. Ray Jeffery (Andresen, 2010, p. 21). Here, the term used for the environment is “the environmental backcloth”—a term coined by Brantingham and Brantingham (1981)—that repesents the built environment, social and cultural norms, institutions, and the legal environment. The difference between Jeffery’s (1979) explanation of the environment and the environmental backcloth is that the latter recognises the dynamic (changing) nature of our environment. Brantingham and Brantingham (1993) emphasised this dynamic nature of our environment, which is often described using the metaphor of a flag: its emblems and designs make the flag two dimensional, however, since the nature of our environment is so dynamic, the backcloth includes the third dimension of the flag blowing in the wind (Andresen, 2010). “Some of the change in our environment is very slow such as the road network in an established urban centre.” (Andresen, 2010, p. 23).
The Four Elements of the City
To better understand the geometry of crime, Brantingham and Brantingham (1993) used Lynch’s (1960) classification of the four elements of cities. These four elements are as follows: nodes, paths, districts, and edges, which are described in more detail in Table 16.2 below.
| Nodes |
|
|---|---|
| Paths |
|
| Districts |
|
| Edges |
|
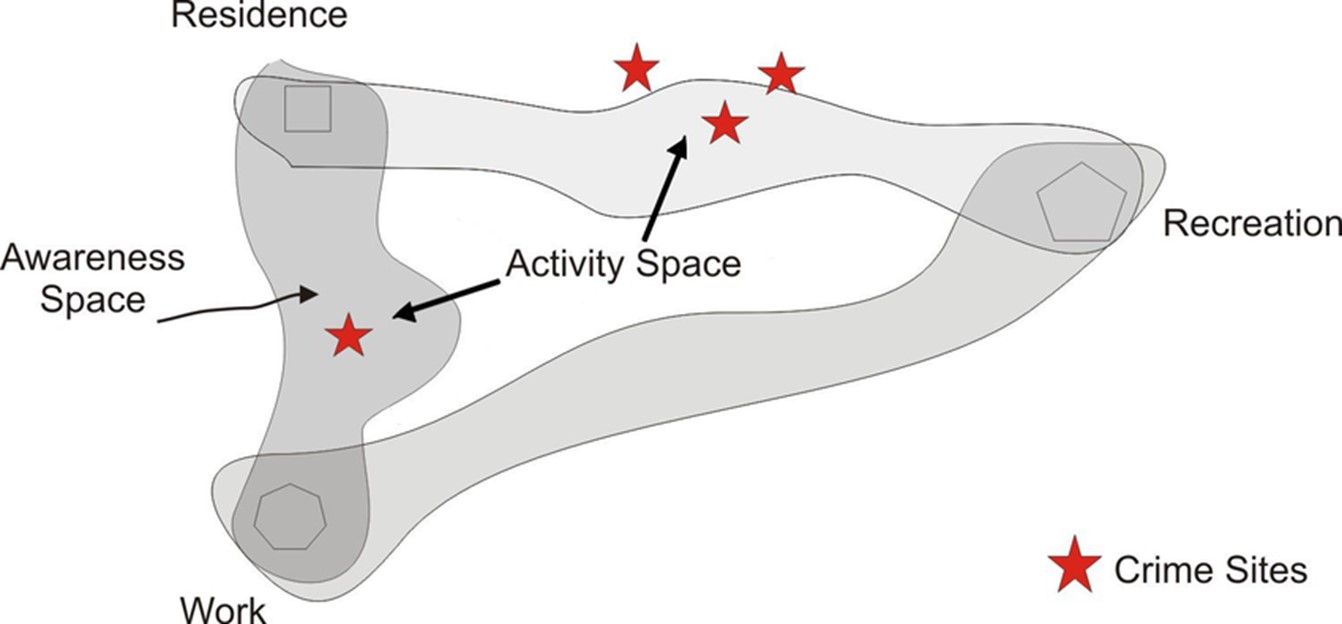
Brantingham and Brantingham (1981) use nodes and paths to generate maps for the purposes of examining where we spend our time and the pathways between those spaces. Essentially, these maps represent our activity space. Over time, our activity space becomes our awareness space, because “we develop knowledge and attachments to different locations such that we develop a sense of place, feeling comfortable in some areas and uncomfortable in other areas” (Andresen, 2010, p. 23). Understanding awareness space is important because we manage risk through it by avoiding places or being more “on guard” in places where we are uncomfortable. The importance of our activity space is that if “we are to be victims of crime this victimisation will most probably occur in our primary activity space simply because that is where we spend the majority of our time” (Andresen, 2010, p. 23). Further, criminals also favour their own activity spaces to commit crimes and identify targets. Knowledge of places outside of one’s activity space is likely to exist according to the principle of distance decay, wherein a person will have greater awareness of places geographically proximal to their activity space. See Figure 16.2 below for an illustration of the awareness and activity spaces of criminals.
To understand the geometry of crime, the above-mentioned discussion on nodes, paths, activity space, and awareness space of offenders is critical because it takes time and effort to overcome distance, so offenders will search areas for criminal opportunities that are going to intersect with their activity space. Consequently, Brantingham and Brantingham “mark the search areas of the immediate surroundings of activity nodes and the linear paths between them as high-intensity search areas, steadily decreasing that intensity with distance from the nodes and paths” (Andresen, 2010, pp. 23-24). To clarify, “search area” refers to the target and/or victim selection on the part of the offender. More importantly, potential offenders have similar activity patterns as the rest of the population.
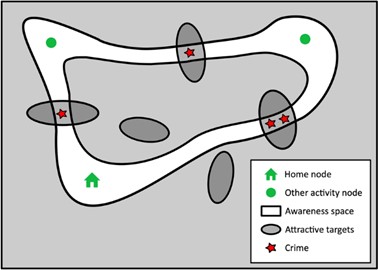
Understanding how someone moves through (and becomes part of) an environment can provide an understanding of how potential offenders move through (and become part of) that same environment. Subsequently, when our activity spaces overlap with those of potential offenders, we can become victims of crime (Andresen, 2010). This overlap often occurs more often throughout the day as potential victims share nodes and pathways with potential offenders. As Andresen (2010) states, “[t]his is simply because of the nature of urban environments largely dictating where people live, work, shop, and so on—we are all at the mercy of the urban planners of yesteryear” (p. 24). Motivated offenders can blend into the environment and are able to search for targets. For example, theft (automotive related) will increase at nodes and along paths that have a higher degree of automotive theft opportunities (e.g., unguarded parking lots). Another example would be assaults, where it will increase at nodes that have a high degree of concentration of individuals, such as at closing time in an entertainment district with bars and nightclubs in close proximity. Thus, crime tends to be concentrated in places within these high crime areas (Van Sleeuwen et al., 2021). For further clarification, see Figure 16.3 below to view how offenders are most likely to commit crime (the stars) at those locations where their individual awareness space (in white) intersects with the spatial distribution of suitable targets (the dark ellipses).
In this framework, the concept of edge is also important as it occurs at the boundary between two or more districts (Brantingham & Brantingham, 1993). Edges are locations with an elevated risk of criminal victimisation and are boundaries between different areas that represent an area in transition from one use to another. Further, an edge could be a physical boundary (e.g., a body of water) delineating a change from one area to the next (another example would be crossing railroad tracks). Brantingham & Brantingham (1975) conducted research in this area while focusing on residential burglary. The researchers found that burglary rates were substantially higher for street blocks bordering on the edges compared to burglary rates in the interior of neighbourhoods. They have also conducted research on gang violence (Brantingham et al., 2012) and found that edges are the places where gang violence strongly clusters. Thus, the presence of edges (where they are and how many are identified) is particularly instructive for understanding crime concentrations at places.
To build on this idea, an examination of “hot spot” areas is beneficial (Ratcliffe, 2010). Hot spots are areas where criminal activity is focused compared with surrounding areas. There are three kinds of hot spot places: crime generators, crime attractors, and crime enablers. First, crime generators are places numerous people are interested in and are unrelated to criminal motivation (e.g., shopping areas, festivals, and sporting events). Crime attractors, on the other hand, are well known to offenders and provide many criminal opportunities (e.g., prostitution and drug areas). Lastly, crime enablers are places where there is little regulation of behaviour, and rules of conduct are either absent or not enforced (e.g., removing a parking lot attendant would allow people to loiter or could perhaps result in thefts from vehicles).
A final, brief note about the geometric theory is that it predicts that the majority of crime will occur within “a small percentage of the available area within an urban centre; for example, 80 percent of crimes may occur within 20 percent of the land area in a city” (Andresen, 2010, p. 25). Further, studies have empirically shown the uneven spatial distribution of crime within urban centres in Canada (Curman et al., 2015) and in the United States (Sherman et al., 1989; Weisburd et al., 2004).
demonstrates how individuals develop an individual awareness space that consists of their major routine activity nodes (e.g., home, school, workplaces – activity spaces): the travel paths that connect them and everything within the visual range of the offender
a term coined by Brantingham and Brantingham (1981) which represents the built environment, social and cultural norms, institutions, and the legal environment
consists of places (conceptualized as points) that are places within the city that a person travels to and from (e.g., business, entertainment, or industrial districts in the context of large urban centres)
represents the channels that we use to move from node to node often limited by streets, walkways, and public transit
regions within the cities that are defined as areas that have commonalities and identifying features such that they are a congruent spatial units such that any differences within the district must be smaller than the differences that exist between districts
the boundaries between districts that may be physical and distinct (literally crossing the tracks) or they may be subtle such as the gradual change as one passes from one neighbourhood to the next
the subset of locations that people directly experience during their activities, consisting of activity nodes where people spend nontrivial amounts of time carrying out activities and the paths (routes) between them.
the places of which a person is aware
