18 Creating Training or Process Infographics
Arley’s Comments:
Great work! You’ve done a lot of effective research and have clearly organized this section. You give a lot of great advice to the reader and have shown some effective examples. My biggest piece of feedback would be to think a little more about the brand voice. You’re getting close, but you can work on the sentence level to make sure that your brand voice is consistent. Overall, good work!
Judy’s comments:
Overall there is a lot of great information here. It is well written, easy to read, and engaging. It is also well researched giving the content credibility. Where there is room for improvement is including: information on training vs. process infographics (the focus was on process infographics but at times mention both – both should be covered and organized accordingly), what is the difference between these?, when should a training infographic vs. a process infographic be used?, samples of both, samples of infographics related to the HR areas listed below. Lastly, References should follow APA formatting.
Learning Objectives
By the end of this chapter, you will learn about:
- Define Process Infographics ?
- Define Training Infographics ?
- Explain why HR managers use Process Infographics.
- Identify the steps to create effective Process or Training Infographics.
- Uses of Training or Process Infographic
- Identify the common mistakes in creating Process Infographics.
- Some widely used tools for developing Process Infographics.
- Some Examples of Process Infographics
- Samples of Process Infographic related to HR areas.
- Samples of Training Infographic
- Video Related to creating Training/ Process Infographic
- References
What is Process Infographics?
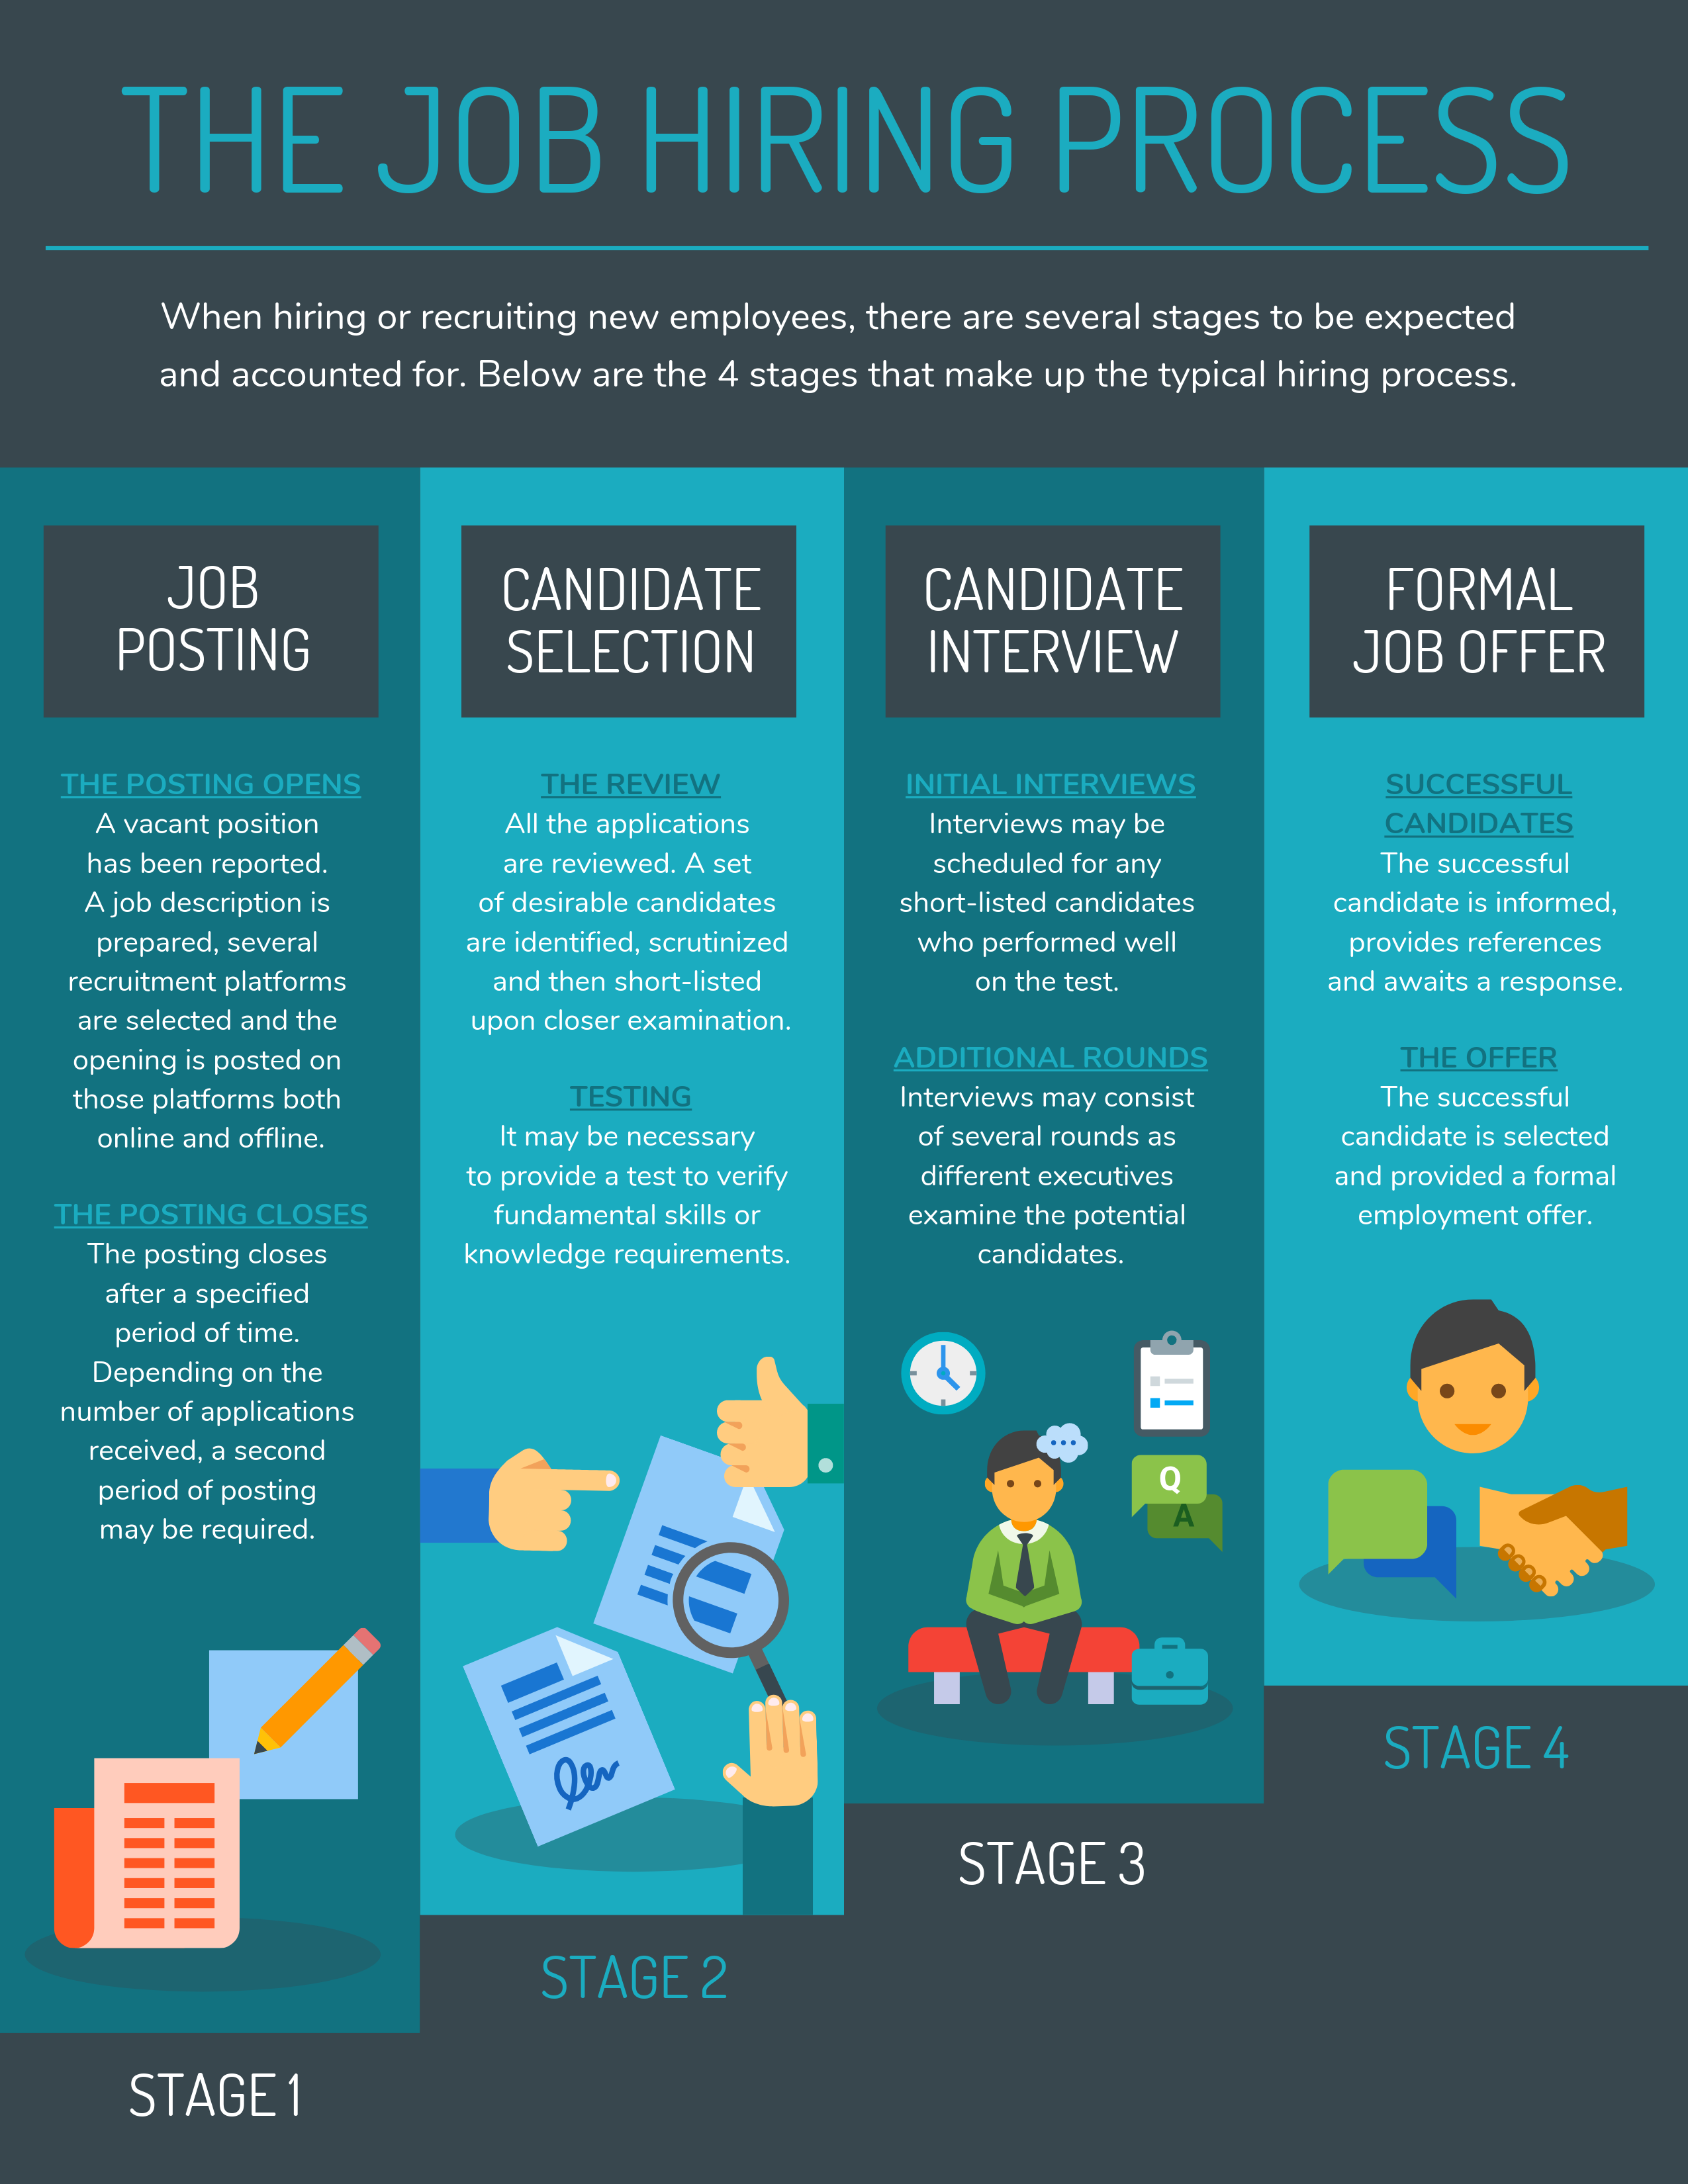
A Process Infographics is a visual representation of various steps of a complex process to make it easier to read and interpret. According to a blog by Boryslava Omelchenko, “Process infographics (otherwise known as flowcharts or “how it works” infographics) describe and show the way a certain process flows. In other words, by using a process infographic you explain how many, in what sequence, and what kind of steps should be taken in a particular process with the help of visuals” (Omelchenko, 2019). The Job Hiring Process is an example.
What is Training Infographic
There are many visuals and infographic are used for training purpose to train employees on various things. Training Infographic are used to train new employees and educated those employees who are working with in company. So, with the help of training infographic, HR managers Provide a relevant information about company’s growth, sales or services, impact and directions about productivity and some different safety measure to keep employees safe. (Vernons, 2016)
Significance of Process Infographics
Presenting large data in text can be boring for both presenter, and reader. Therefore, infographics are widely used in businesses to represent large and complex processes. An infographic serves various purposes:
- It visualizes, summarizes, and simplifies the processes (Mcguire, 2020) .
- If followed thoroughly, it ensures better outcome.
- It improves decision-making by visualizing step-by-step approach towards a goal (Tomboc, 2020) .
- It captivates audience’s attention.
- It increases retention in readers.
- It is shareable and can reach greater number of people.
According to results of a 2017 Study, 84% of companies who used Infographics found them effective.
Process Infographics for HR managers

As a HR manger, you need to focus on several aspects where Infographics can assist you in exceptional way. The areas where this visual communication proves to be beneficial are:
- Planning
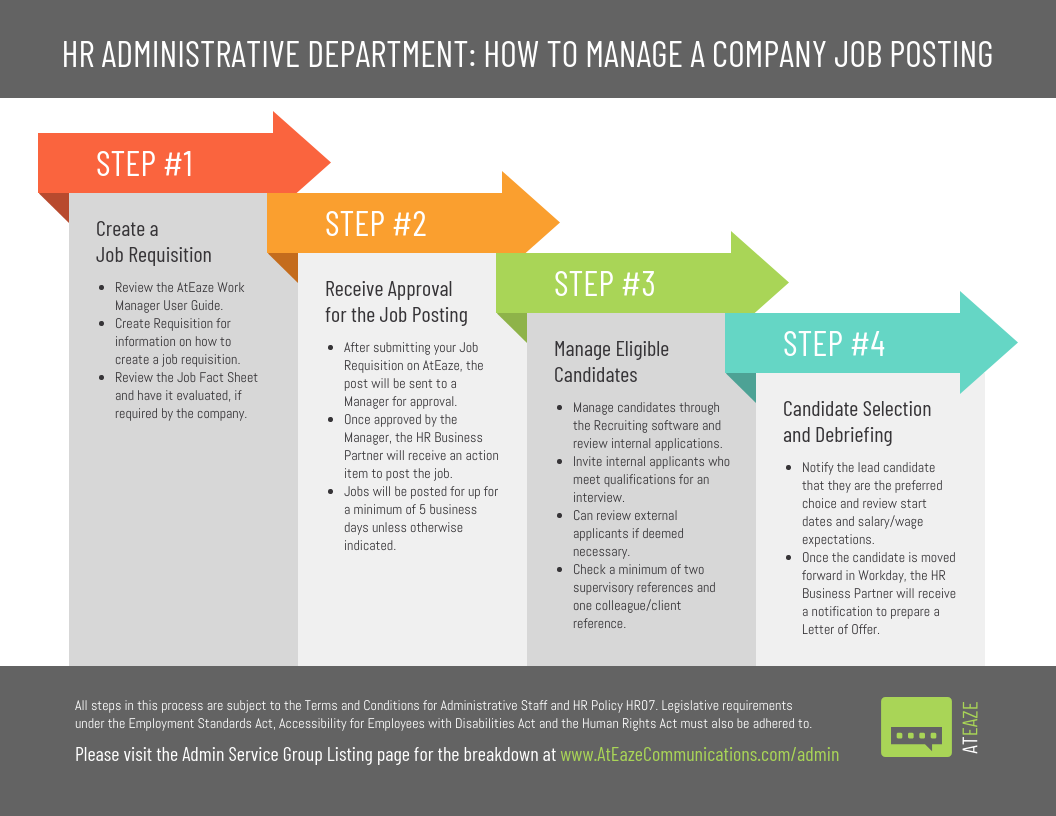
- Job Posting
- Recruitment
- Hiring
- Selection
- New Employee Onboarding
- Training
- Performance management
- detailed instructions
- directional guidelines
Steps to create effective Process/Training infographics

Use the following steps given by Margie Meacham to create your infographics:
Step 1. Identify the purpose of infographics and collect data.
Step 2. Develop a rough outline of process to have visual idea of how steps follow from beginning to end.
Step 3. Then, choose each step or section and create separate visual for them. Use a short descriptive header or label to define the section.
Step 4. Build charts, graphs, tables, and simple images to represent your information.
Step 5. Give Arrows to your process or training infographic.
Step 6. Limit the use of text in infographics as it can be hard to read.
Step 7. Try to be creative in using fonts and sizes. As Margie Meacham explained, “For example, if I’m designing an infographic on machine shop safety, I might put the word “danger” in big, bold, red letters.”
Step 8. Choose a title for your Infographics.
Step 9 . Add any resources, references, or footnotes to the bottom of your infographics to help readers have further research.
Step 10. After that add some social media sharing links in your infographic, so that corporate learners who train and provide e-learning to educate employees can share it
Step 1 1 . In last, audience feedback is necessary to get reviews about infographic. (Christopher, 2016)
For additional help in creating training infographics, check the article by Crystal Hunter
Also, have a look on Do and Don’ts on blog by Orana Velarde
Uses of Training or Process infographic
- Training Infographic:
- Training infographic boost the employees performance
- Training Infographic make complex easier to understand and interesting (Lydia, 2021)
- Training Infographic also used in workplace safety measure.
- It is used to train employee regarding company’s productive growth, workplace procedure.
- Process Infographic: Process Infographics are mainly used to represent the complex process in simple and engaging way. So, there are many areas where we can used process infographic.
- Process infographic are used to Show different marketing strategies
- Process infographic are also used in HR related areas such as : hiring, Onboarding, Recruitment , training and many more
- It can be also used to show brand voice on different social media platforms.
- HR managers can also used process infographic to define the concept of managerial planning
- Process infographic are also used to define the process of Product Designing. (Sara, 2020)
- So, Mainly the difference between process and training infographic is that there are some visuals such as infographic to show process mapping in different topic and in training infographic there are visuals and infographic used for training purpose to train employees on something related to real business and workplace safety measure.
Tools to make effective infographics.
Following tools provide creative ideas and in-built templates for businesses processes.
Some examples of effective infographics
- Workplace training Infographics

Samples of infographic Related to HR Areas
Infographic are a quick and easy way to gain some interesting information about different topics. There are many infographics which HR managers are used to show different processes related to HR areas are as follows:
1. Planning Process Infographic

2. Job Posting Process Infographic

3. Recruitment Process Infographic

4. Hiring Process Infographic

5. Selection Process Infographic

6. Employee Onboarding Infographic
![Effective Onboarding Tips for HR Professionals [Infographic]](https://www.insightsforprofessionals.com/BlogResources/BlogPostResources/dde66b9e-bbed-4a04-a2fa-2d5239ac3f68.png)
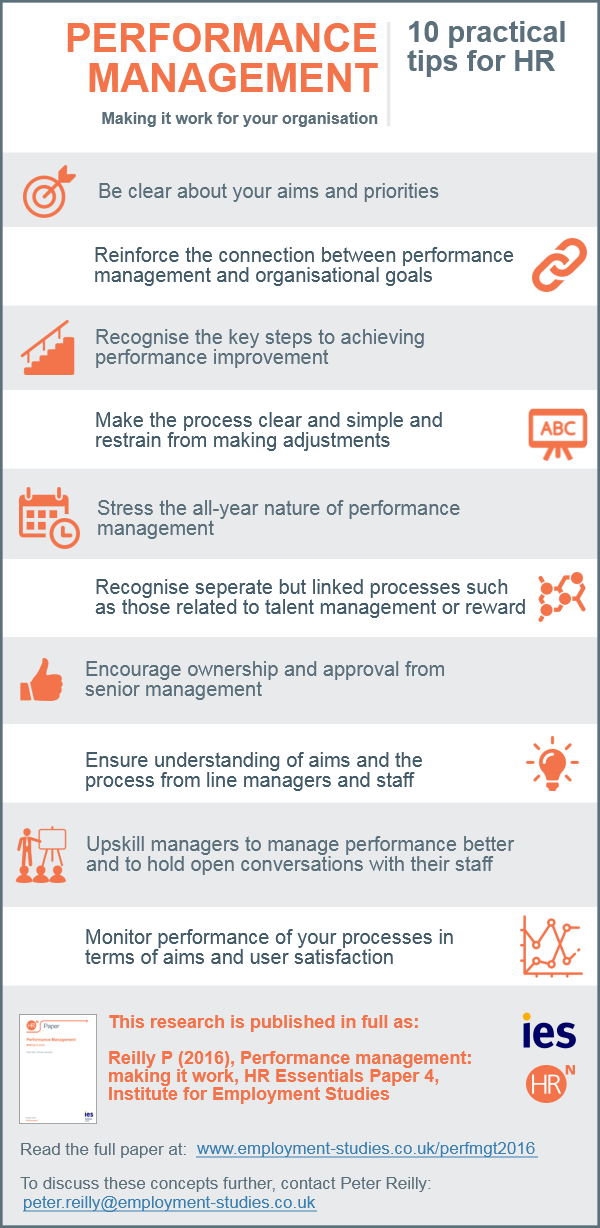
7. Performance Management Process Infographic

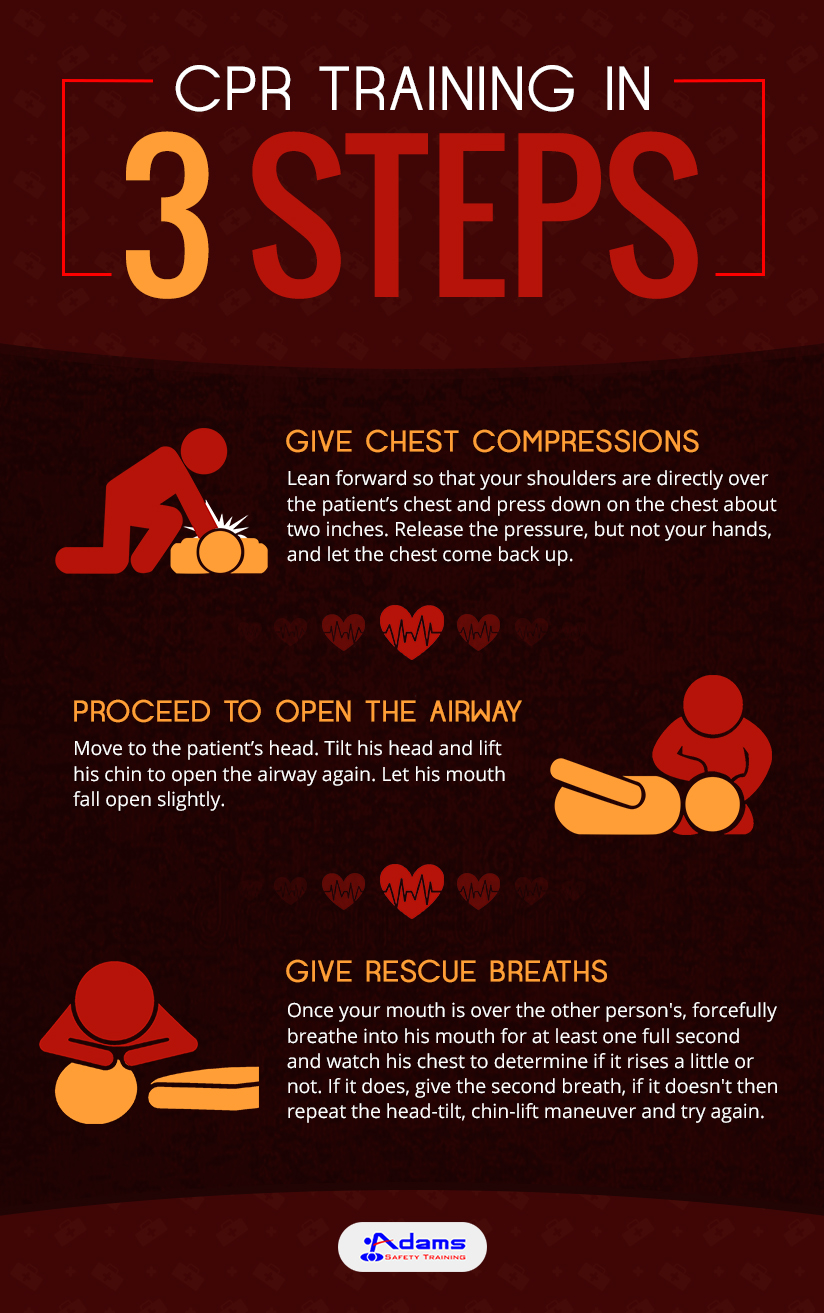
Sample of Training Infographic related to real business or safety measure:


Videos Related to Training/Process Infographic
References:
-
Omelchenko, B. (2019). All You Need to Know About Process Infographics [Tips & Templates]. MonsterPost. Retrieved 21 June 2021, from https://www.templatemonster.com/blog/process-infographic-template/.
-
venngage.com. [Image]. Retrieved 23 June 2021, from https://venngage.com/gallery/process-infographic-examples-inspiration/.
-
MCGUIRE, S. (2020). 28 Process Infographic Templates and Visualization Tips – Venngage. Venngage. Retrieved 22 June 2021, from https://venngage.com/blog/process-infographic-template/.
-
Tomboc, K. (2020). 20 Process Infographic Templates to Help You Save Time. Simple Infographic Maker Tool by Easelly. Retrieved 22 June 2021, from https://www.easel.ly/blog/process-infographic-templates-and-examples/.
-
Conner, C. (2017). The Data Is In: Infographics Are Growing And Thriving In 2017 (And Beyond). Forbes. Retrieved 22 June 2021, from https://www.forbes.com/sites/cherylsnappconner/2017/10/19/the-data-is-in-infographics-are-growing-and-thriving-in-2017-and-beyond/?sh=4c0af3ef137c.
-
Meacham, M. (2015). Use Infographics to Enhance Training. Talent Development, 69(8), 76-77. https://ezproxy.kpu.ca:2443/login?url=https://www-proquest-com.ezproxy.kpu.ca:2443/trade-journals/use-infographics-enhance-training/docview/1705353094/se-2?accountid=35875
-
Hunter, C. (2018). 3 Tips For Incorporating Infographics Into Training – eLearning Industry. eLearning Industry. Retrieved 23 June 2021, from https://elearningindustry.com/incorporating-infographics-into-training-tips.
-
Velarde, O. (2021). Infographic Design Tutorial Do’s and Don’ts [Blog]. Retrieved 23 June 2021, from https://visme.co/blog/infographic-design-tutorial/.
-
Vernons. (2016, June 25). Train Employees with Infographic . Retrieved from Easelly.com: https://www.easel.ly/blog/make-it-stick-train-employees-with-infographics/
-
Christopher, P. (2016, April 20). steps to create online training infographic. Retrieved from eLearning Industry: https://elearningindustry.com/7-steps-to-create-online-training-infographic
-
Lydia, H. (2021, January 17). Retrieved from vennage.com: https://venngage.com/blog/employee-training-and-development/
-
Sara, M. (2020, may 18). Retrieved from Venngage.com: https://venngage.com/blog/process-infographic-template/
