
10 Web Analytics Basics
Picture the scene: you’ve opened up a new fashion retail outlet in the trendiest shopping center in town. You’ve spent a small fortune on advertising and branding. You’ve gone to great lengths to ensure that you’re stocking all the prestige brands. Come opening day, your store is inundated with visitors and potential customers. And yet, you are hardly making any sales. Could it be because you have one cashier for every hundred customers? Or maybe it’s the fact that the smell of your freshly painted walls is chasing customers away before they complete a purchase.
While it can be difficult to isolate and track the factors affecting your revenue in this fictional store, move it online and you have a wealth of resources available to assist you with tracking, analyzing, and optimizing your performance.
To a marketer, the Internet offers more than new avenues of creativity. By its very nature, the Internet allows you to track each click to your site and through your site. It takes the guesswork out of pinpointing the successful elements of a campaign and can show you very quickly what’s not working. It all comes down to knowing where to look, knowing what to look for, and knowing what to do with the information you find.
Data-driven decision making
Testing, analyzing, and optimizing are not new to marketing. Being able to gauge the success of any campaign is crucial to growth. When it comes to Web analytics and conversion optimization, it is all about preparation. It is not just about collecting data; you need to know what data you are going to use. Once data have been collected, you need to analyze them and let the numbers inform your optimization tasks.
Goals, events, and key performance indicators
The key to the success of any Web site or online campaign is that it is designed with clearly defined goals in mind. These will be used to measure the success of the Web site or campaign and are crucial to maintaining focus within online activities. The goal of a Web site or campaign may depend on the type of industry, but usually it will be an action that results in revenue for the company. The goal of a Web site is also intrinsically linked to the action that you want visitors to perform.
In order to test the success of your Web site, you need to remember the “TAO” of conversion optimization:
- Track
- Analyze
- Optimize
Using your goals and KPIs, you’ll know what metrics you will be tracking. You will then need to analyze these results and take appropriate actions. And the testing begins again!
Different types of websites and their conversion priorities
Although a Web site has an ultimate goal, the process of achieving that goal can be broken down into several steps. These are called events or micro-conversions. Analyzing each step in the process is called funnel analysis or path analysis and is critical to understanding where problems in the conversion process may lie. The clicks visitors make once landed on a site, whether they follow the desired steps or not, are referred to as a click path.
How it works
Web analytics programs are typically installed by a web developer onto every page of a website where you want to capture data. Collecting data for the sake of collecting data is not the intention! Marketers should determine up front what their goals are and what data they need to capture to measure them. An excess of data leads to “analysis paralysis” and few insights will be captured while a lot of money has been spent.
A small “snippet” of html code is inserted into the HEAD tag of a web page; this code passes information about the web user (visitor) to the analytics program – such as Google Analytics. Every web analytics program provides a dashboard to view all the captured data.
Analyze this
Avinash Kaushik (2007), author of Web Analytics: An Hour a Day, recommends a three-step approach to Web analytics:
- Analyze behavior data that infer the intent of a Web site’s visitors.
- Analyze outcome metrics that show how many visitors performed the goal actions on a Web site.
- Test and analyze data that tell us about the user experience.
Basic web metrics
Below are some of the basic metrics that help us better understand a user’s intent and experience on a web page/site.
- Page view
- Session
- User
- Time on page
- Page entry
- Page exit
Conversion metrics
Conversion metrics are a critical component to web analytics. The terminology associated with conversion metrics include the following:
- Event. A recorded action that has a specific time assigned to it by the browser or the server.
- Conversion. A visitor completing a target action.
- Impression. Each time an advertisement or a page is served.
- Open. Each e-mail that is deemed open. Usually if the images are loaded, an e-mail is considered open.
Calculated metrics
These metrics are calculated by performing a simple ratio, then in most cases, expressed as a percentage.
- Average page depth: page views/sessions
- Average session duration
- Site bounce rate
- Page bounce rate
- Page entrance rate
- Page exit rate
- Unique page views
Popular retail metrics
The most important retail metrics include the following:
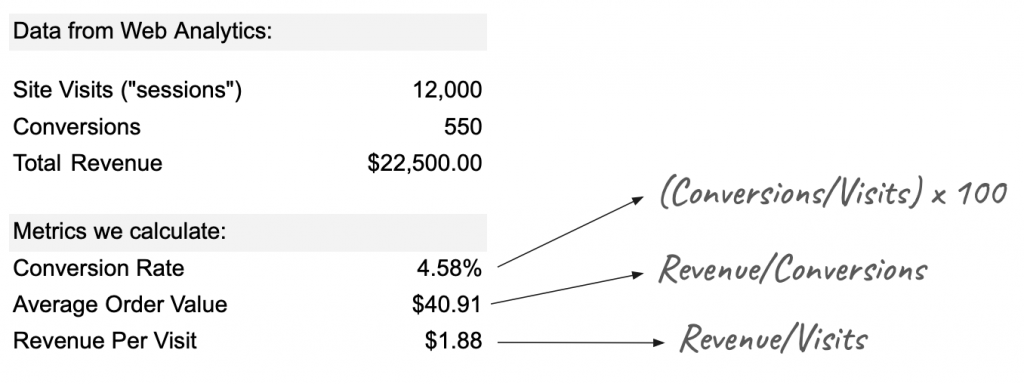
- Conversion rates: (number of conversions/visits) x 100
- Revenue: Selling price x quantity
- Revenue per visitor: Revenue/visits
Examples
Retail site analytics
For a retail site, optimizing the conversion rate is a primary goal. It is also important to increase both the average order value and the revenue per visit.
Revenue Per Visitor (RPV)
- Measures amount of money generated each time a customer visits your website
- Estimates the value of each additional visitor to a site
RPV is useful because it helps the online retailer see when to evaluate new visitor acquisition efforts. It is also helpful in determining how much the retailer can afford to spend on acquiring a new user.
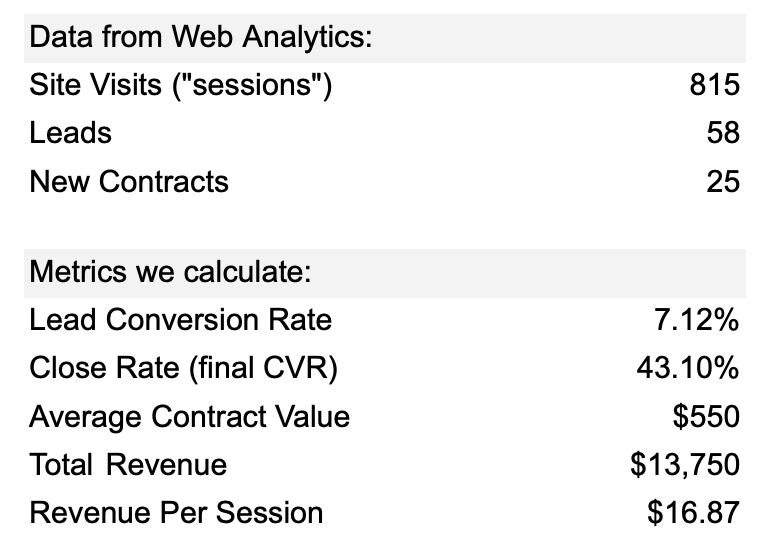
Lead site analytics
For a lead generation site, calculating the revenue per visit (session) gives us a threshold: in this example, we should not be spending more than $16.87 for each website visitor.
Bounce rates
A bounce rate measure the percentage of visitors who enter a site then leave without continuing on to other pages within the site. It’s a – came, saw, left – type of scenario. We use the term “sticky” to describe a web page that has content on it that keeps a visitor engaged for a long period of time (and by long, that just means they don’t “bounce” off). A sticky site also refers to one that keeps a visitor on its pages and doesn’t cause them to exit to another site entirely. If a visitor bounces from a web page this may indicate a problem with engagement. It is worth noting, however that some pages are naturally going to have high bounce rates: for example, a web page that has information that the user will skim quickly and not have a reason to stay longer: store operating hours; phone number; or other “quick” bits of information that they can gather in seconds before leaving.
Attribution
In a web analytics context, attribution determines who (or in this case, what) gets credit for bringing a visitor to a landing page. Did the user come via an online advertisement? Or was it an email? Perhaps they typed the URL into the address bar directly. Attribution shouldn’t be a guessing game for marketers; the data is important because it tells us which channel is providing us with what percentage of our overall traffic.
There are several different ways credit can be assigned, however, which means there are many different attribution models:
- Last interaction model – this model assigns 100% of the credit to the channel (or touch point) that immediately precede a conversion. Criticized for being too “simplistic” this model is the easiest and probably the most common way to give credit to advertising efforts. It is believed that search engines tend to receive more credit than they should in this model.
- First interaction model – 100% of the credit to the very first channel that initiated the conversion path.
- Linear attribution model – an equal amount of credit is assigned to every channel in the conversion path
- Time-decay model – some credit is assigned to each channel in the conversion path, but the amount of credit reduces (decays) the further back in time the channel was interacted with (Wakefield, 2019).
Videos
Introduction to Web Analytics
More about this topic
Text Attributions
- All of the content up to the section “Examples” and the section under “Bounce Rates” and “Attribution” are adapted from eMarketing: The Essential Guide to Online Marketing by Rob Stokes and Saylor Academy which is licensed under a CC BY-NC-SA 4.0 International License.
References
Kaushik, A. (2007). Web Analytics: An Hour a Day. Hoboken, NJ: Wiley, 15–19.
Wakefield, D. (2019, October 28). What is time-decay attribution? Call Rail. https://www.callrail.com/blog/what-is-time-decay-attribution/
