
27 4.4 2D Inequality and Absolute Value Graphs
Graphing a 2D Inequality
To graph an inequality, borrow the strategy used to draw a line graph in 2D. To do this, replace the inequality with an equal sign.
Example 4.4.1
Consider the following inequalities:
\[\begin{array}{rrrrr}
3x&+&2y&<&12 \\
3x&+&2y&\le &12 \\
3x&+&2y&>&12 \\
3x&+&2y&\ge &12
\end{array}\]
All can be changed to \(3x + 2y = 12\) by replacing the inequality sign with =.
It is then possible to create a data table using the new equation.
Create a data table of values for the equation \(3x + 2y = 12.\)
| \(x\) | \(y\) |
|---|---|
| 0 | 6 |
| 2 | 3 |
| 4 | 0 |
| 6 | −3 |
Using these values, plot the data points on a graph.
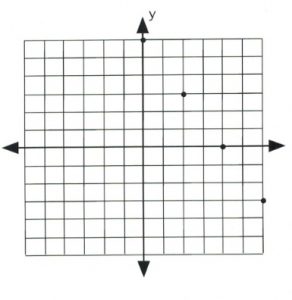
Once the data points are plotted, draw a line that connects them all. The type of line drawn depends on the original inequality that was replaced.
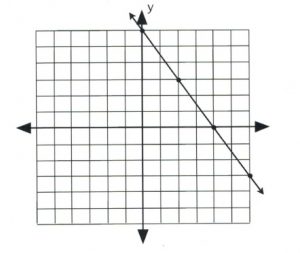
If the inequality had ≤ or ≥, then draw a solid line to represent data points that are on the line.
![]()
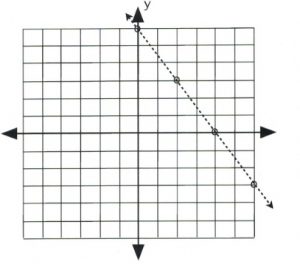
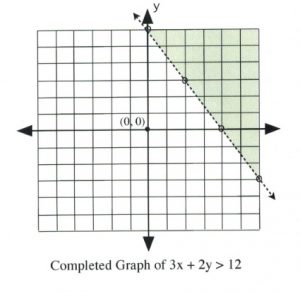
If the inequality had < or >, then draw a dashed line instead to indicate that some data points are excluded.
![]()
If the inequality is either \(3x + 2y \le 12\) or \(3x + 2y \ge 12\), then draw its graph using a solid line and solid dots.
If the inequality is either \(3x + 2y < 12\) or \(3x + 2y > 12\), then draw its graph using a dashed line and hollow dots.
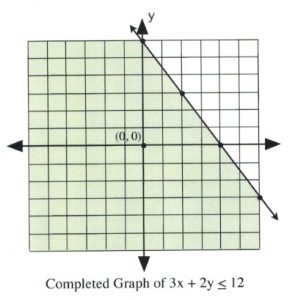
There remains only one step to complete this graph: finding which side of the line makes the inequality true and shading it. The easiest way to do this is to choose the data point \((0, 0)\).
It is evident that, for \(3(0) + 2(0) \le 12\) and \(3(0) + 2(0) < 12\), the data point \((0, 0)\) is true for the inequality. In this case, shade the side of the line that contains the data point \((0, 0)\).
It is also clear that, for \(3(0) + 2(0) \ge 12\) and \(3(0) + 2(0) > 12\), the data point \((0, 0)\) is false for the inequality. In this case, shade the side of the line that does not contain the data point \((0, 0)\).
Graphing an Absolute Value Function
To graph an absolute value function, first create a data table using the absolute value part of the equation.
The data point that is started with is the one that makes the absolute value equal to 0 (this is the \(x\)-value of the vertex). Calculating the value of this point is quite simple.
For example, for \(| x - 3 |\), the value \(x = 3\) makes the absolute value equal to 0.
Examples of others are:
\[\begin{array}{rrrrrrrrr}
|x&+&2|&=&0&\text{when}&x&=&-2 \\
|x&-&11|&=&0&\text{when}&x&=&11 \\
|x&+&9|&=&0&\text{when}&x&=&-9 \\
\end{array}\]
The graph of an absolute value equation will be a V-shape that opens upward for any positive absolute function and opens downward for any negative absolute value function.
Example 4.4.2
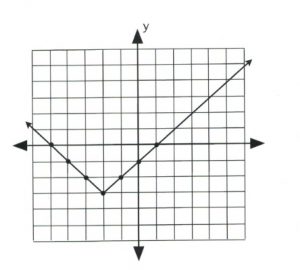
Plot the graph of \(y = | x + 2 | - 3.\)
The data point that gives the \(x\)-value of the vertex is \(| x + 2 | = 0,\) in which \(x = -2.\) This is the first value.
For \(x = -2, y = | -2 + 2 | - 3,\) which yields \(y = -3.\)
Now pick \(x\)-values that are larger and less than −2 to get three data points on both sides of the vertex, \((-2, -3).\)
| \(x\) | \(y\) |
|---|---|
| 1 | 0 |
| 0 | −1 |
| −1 | −2 |
| −2 | −3 |
| −3 | −2 |
| −4 | −1 |
| −5 | 0 |
Once there are three data points on either side of the vertex, plot and connect them in a line. The graph is complete.
Example 4.4.3
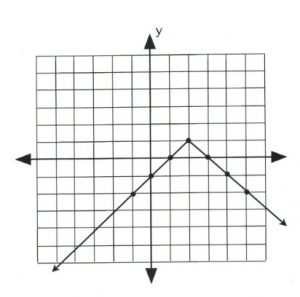
Plot the graph of \(y = -| x - 2 | + 1.\)
The data point that gives the \(x\)-value of the vertex is \(| x - 2 | = 0,\) in which \(x = 2.\) This is the first value.
For \(x = 2, y = -| 2 - 2 | + 1,\) which yields \(y = 1.\)
Now pick \(x\)-values that are larger and less than 2 to get three data points on both sides of the vertex, \((2, 1).\)
| \(x\) | \(y\) |
|---|---|
| 5 | −2 |
| 4 | −1 |
| 3 | 0 |
| 2 | 1 |
| 1 | 0 |
| 0 | −1 |
| −1 | −2 |
Once there are three data points on either side of the vertex, plot and connect them in a line. The graph is complete.
Questions
For questions 1 to 8, graph each linear inequality.
- \(y > 3x + 2\)
- \(3x - 4y > 12\)
- \(2y \ge 3x + 6\)
- \(3x - 2y \ge 6\)
- \(2y > 5x + 10\)
- \(5x + 4y > -20\)
- \(4y \ge 5x + 20\)
- \(5x + 2y \ge -10\)
For questions 9 to 16, graph each absolute value equation.
- \(y=|x-4|\)
- \(y=|x-3|+3\)
- \(y=|x-2|\)
- \(y=|x-2|+2\)
- \(y=-|x-2|\)
- \(y=-|x-2|+2\)
- \(y=-|x+2|\)
- \(y=-|x+2|+2\)
