3 Results Section- Data Tables
3.1 Presentation of Data in Tables
The tables in the Results section are a useful way to summarize complex data (a.k.a. raw data) because simple formatting of tables is often best (See Table 1). The format of a table must follow APA Style.
Table Activity
In Table 1 below you can click on the Hotspots of the table to read the descriptions to learn more about the APA Style format for tables. Note, to expand the image to full screen you can click on the expand button on the top right corner of the image.
All tables presented in the Results section of a lab report must be referred to in the written text of the results section. Otherwise, that table should not be in the Results section. Instead place it in the Appendix section. See the example of how to properly cite a table in the Results section below.
Within the Results section of your lab report, the table (along with its caption) should always fit onto one page and be left justified. Check your final page formatting once your document is written and the final editing is completed. If you are having formatting issues, it is best to insert a page break before the table to make it all fit onto one page.
Raw data tables are located in the Appendix section while summary data tables are in the Results section of a lab report. Summary data tables are a useful way to summarize the more complex data (a.k.a. raw data). More information about raw data tables and summary data tables can be found below.
3.2 What is the difference between a “Raw Data Table” and a “Summary Data Table”?
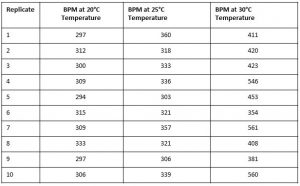
During scientific experiments, we often collect data in a raw data table (see Tables 1 and 2). We use this raw data to do various types of quantitative analysis such as calculating means, variances, standard deviations, 95% confidence intervals, etc. In raw data tables, the APA format does not always need to be followed as at times it can make it difficult to interpret the data and may get too busy. For example, in Table 2 you can see each cell of the table has a visible border on all sides of each cell of the table. In APA Style summary tables, there are only horizontal borders present in certain areas of the table such as the top and bottom of the column headings and at the very bottom of the table indicating where it ends (See Tables 1 and 3). Other horizontal borders may be present depending on the complexity of the table.
Table 2
The pulse rate (BPM) of mice (Mus musculus) at various temperatures (°C)
 Note. Pulse rate measured in beats per minute (BPM).
A summary table contains the processed data (NOT the raw data). For example, it could contain statistical analysis information such as the calculated means, variance, standard deviation, and 95% confidence intervals (See Table 3). The raw data table and the summary table will vary from experiment to experiment depending on what variables you are testing and what type of calculations you are doing to quantitatively analyze the raw data.
Table 3
The mean pulse rate (BPM) of mice (Mus musculus) at various temperatures (C°)
 Note. Pulse rate measured in beats per minute (BPM). Sample size (n) = 10.
Raw data tables along with the calculations done processing them are best placed in the Appendix section of a lab report while summary tables belong embedded in the Results section of the lab report (if requested by your instructor). There are always exceptions, however. Summary tables must be formatted according to APA Style rules. If there are errors in your summary data table your lab instructor will look at your raw data tables and calculations in the Appendix section to determine if the error was in your data collection or calculations. Ideally, if you made an error, you can learn where it was so the error is not repeated in the future.
